Advertisement

CommonHealth: Researchers Say 'High Cost' Adults Can Be Predicted At Age 3

08:03
Download Audio
Resume
Figure 1 from the paper, measuring the concentration of economic-burden outcomes in a birth cohort. The data represent information about 940 people who were born in one hospital in the period 1972–1973 and are lifelong participants in the Dunedin Longitudinal Study. A minority of individuals is shown to account for a majority of outcomes in a birth cohort for each of eight different social and health sectors: social welfare (a), fatherless children (b), smoking (c), excess obese kilograms (d). Each panel displays the cumulative distribution of an outcome in the cohort. To find the proportion of each outcome that 20% of the population accounts for, start at 20% on the vertical axis and follow dashed arrow 1 to the right (to the purple line), then follow arrow 2 up to the blue line, then follow arrow 3 to the left (back to the vertical axis) to read off the corresponding proportion of the total. Each x-axis denotes the count of each respective outcome in its own units (e.g. benefit months, pack-years and so on). (Nature Human Behaviour)

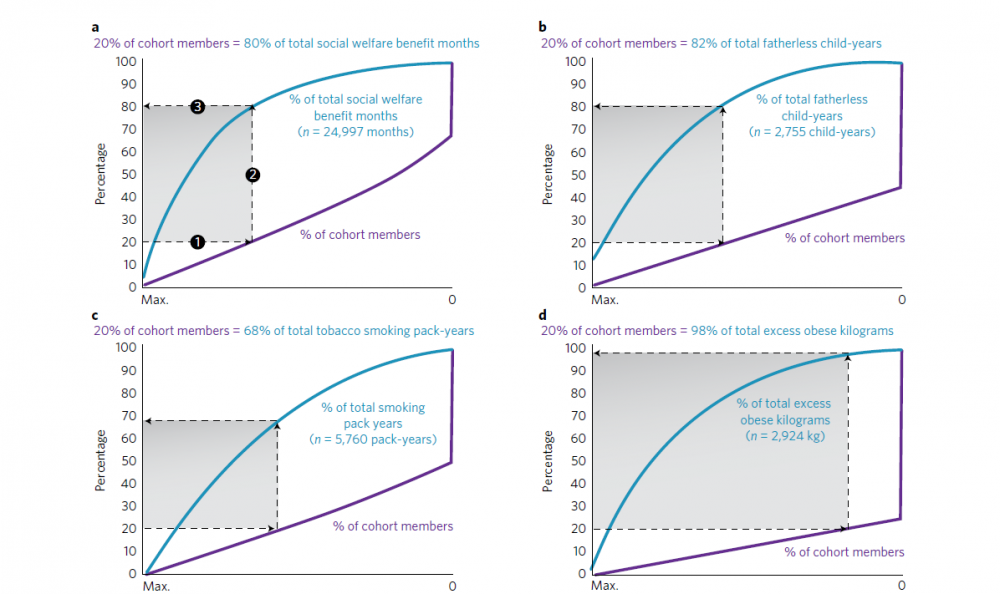
A study out Monday in Nature Human Behavior followed over 1,000 New Zealanders for about 40 years and found that just 20 percent of the group accounted for 36 percent of injury insurance claims, 66 percent of welfare benefits and 81 percent of criminal convictions.

The study also suggests that a child's early years are even more critical than we knew, and what happens before a person is 3 years old could affect if he or she is in that 20 percent and how much the person will cost society in mid-life.

The question is: If doctors know these risk factors exist early on, will those turn into a diagnosis rather than an indicator?

"Would we worry about stigmatizing children by measuring lead levels in their blood?" says Dr. Jack Shonkoff, professor of child health and development at the Harvard T.H. Chan School of Public Health. "If you have an elevated lead level it doesn't mean you have a problem but it means we've identified something early on to prevent the problems that occur later."

We check in with CommonHealth's Carey Goldberg for a full examination of the study.

Guest

Carey Goldberg, host of WBUR's CommonHealth, which tweets @commonhealth.

This segment aired on December 12, 2016.

Related:

Headshot of Alison Bruzek

Alison Bruzek Associate Producer, Radio Boston
Alison Bruzek was a producer for Radio Boston.

More…

Headshot of Carey Goldberg

Carey Goldberg Editor, CommonHealth
Carey Goldberg is the editor of WBUR's CommonHealth section.

More…

Headshot of Meghna Chakrabarti

Meghna Chakrabarti Host, On Point
Meghna Chakrabarti is the host of On Point.

More…

Advertisement

More from Radio Boston

Listen Live
Close