Advertisement
Boston Rivers Were Pretty Clean In 2020, But Sewage Is Still A Problem Says EPA
It’s report card time — for the Charles, Mystic and Neponset Rivers, that is.
As part of an ongoing effort to monitor water quality in these rivers and raise awareness about pollution, the U.S. Environmental Protection Agency (EPA) uses data collected by local watershed groups about bacteria levels to calculate annual letter grades.
Like in years past, most segments of the Charles and Mystic Rivers received As or Bs, indicating that the water met swimming or boating standards most of the time. (This was the first year the Neponset River received a report card, and it too got mostly As and Bs.)
But there were also several Cs issued for parts of the Mystic and Neponset, meaning that the water quality met swimming standards only some of the time and boating standards most of the time. And, owing to ongoing problems with stormwater runoff and sewage, all three rivers had at least one D or F. (The full report cards for each River and its tributaries are listed at the bottom of this story.)

“One of the major problems that we found in these rivers is sewer connections that are illegally hooked up to storm drains,” says Ken Moraff, director of EPA Region 1’s Water Division. “Sewage is supposed to go into sewer pipes that lead to Deer Island and get treated, but sometimes we find a pipe that will go into a stormwater drain. So when it rains — or sometimes even in dry weather — there can be a continuous flow of sewage into a water body.”
Finding these illicit hookups and then fixing them is no easy task, but over the last few decades, cities and towns in the region have made progress. In 2017, for example, Chelsea identified two illicit hookups — one from a big apartment complex and one from the New England Produce Center — and rerouted the waste. The following year, the Island End River ended its failing streak and got a B.
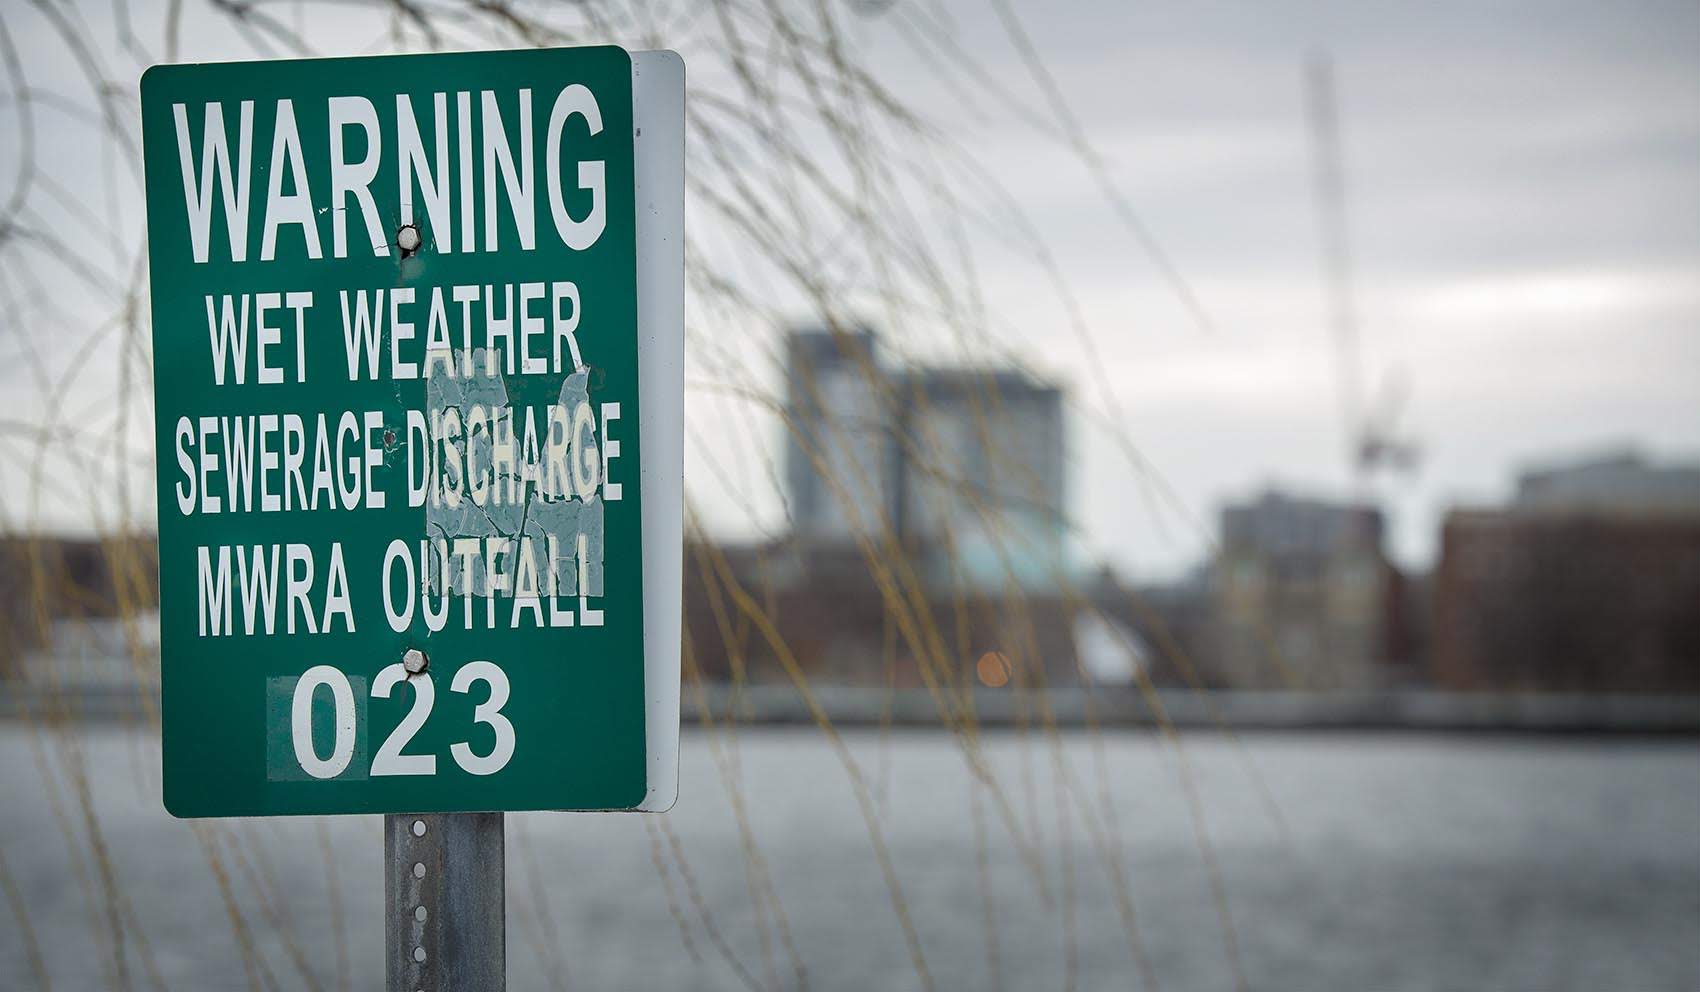
In addition to these improper hookups, two other sewage-related infrastructure problems continue to plague these rivers: combined sewer overflows (CSOs) and leaky wastewater pipes. Both allow untreated sewage to enter the rivers, and during particularly rainy weather can cause E. coli concentrations to spike to dangerous levels.
“Much municipal effort goes into the detective work of hunting down these sources and eliminating them,” Andy Hrycyna of the Mystic River Watershed Association writes in an email. He adds that the city of Cambridge has invested more than $150 million in separating combined pipes to help address serious water quality problems in Alewife Brook.
Regionally, the Massachusetts Water Resources Authority (MWRA) has also worked to repair old pipes and close CSO outfalls. In the last few decades, it has eliminated 35 CSO outfalls, which has reduced wet weather sewage discharges by approximately 87%.
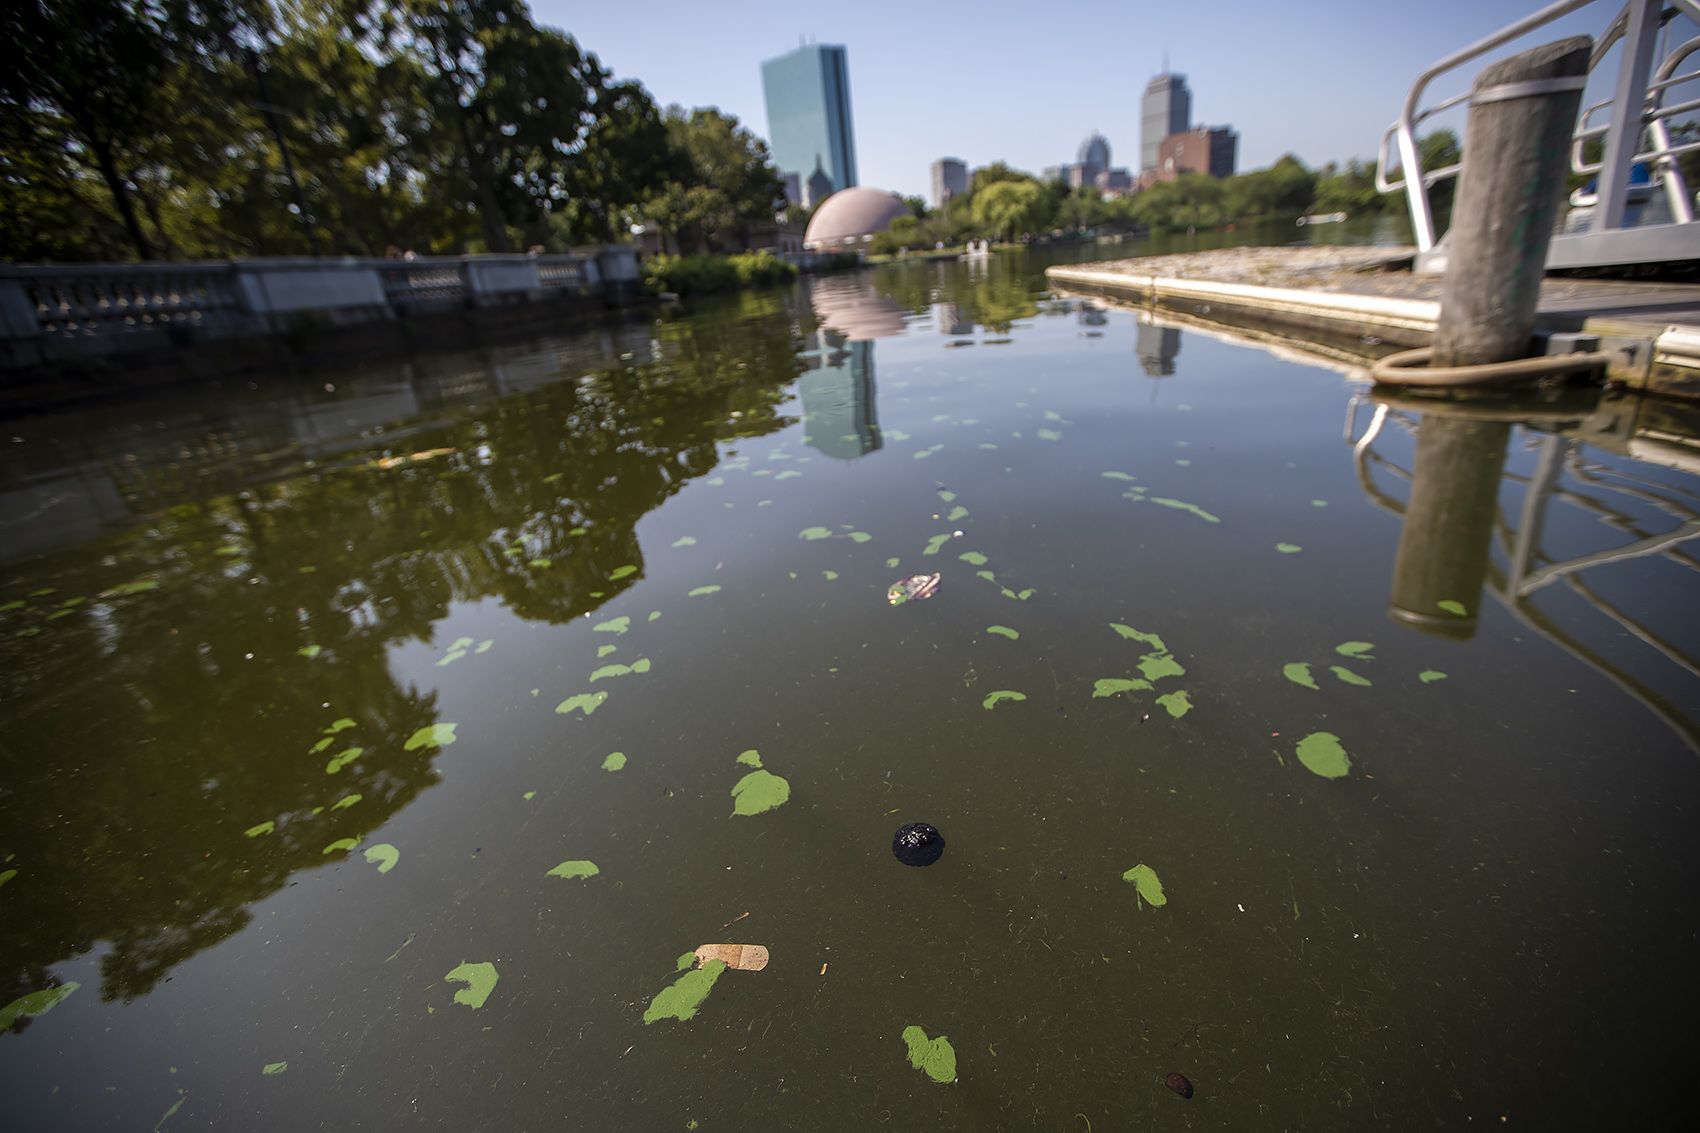
While the EPA’s report cards reflect the level of E. coli in the water, pollutiants from stormwater runoff — like lawn fertilizer, road salt and gasoline, to name a few — also create serious water quality issues; fertilizers in particular can lead to dangerous cyanobacteria blooms during the summer. According to the EPA, these blue-green algae blooms in the region “have occurred with greater frequency over the past several years,” and scientists say climate change is exacerbating the problem.
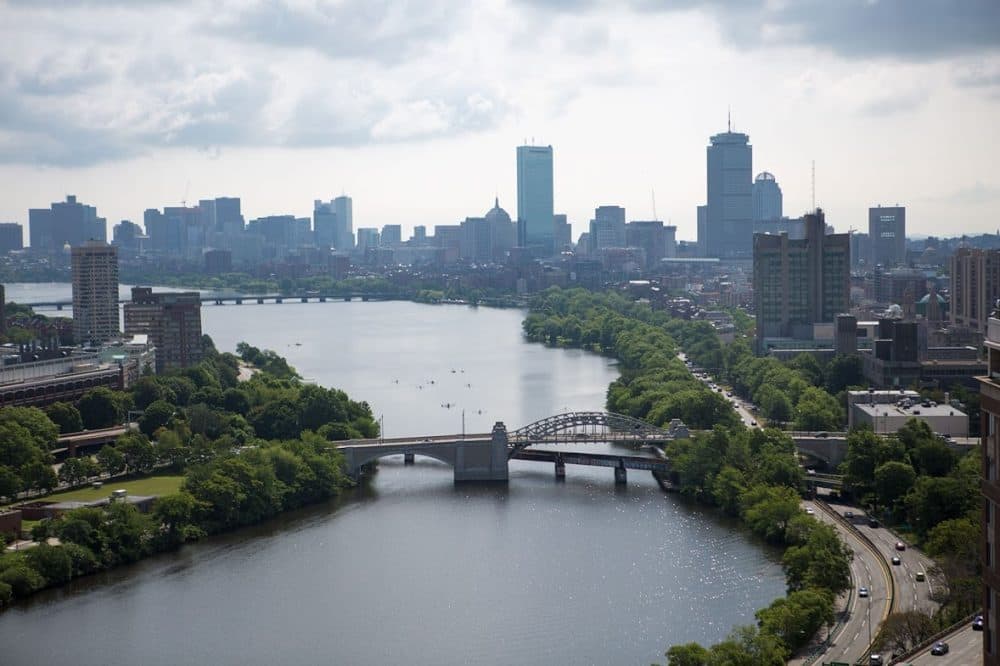
There’s certainly a lot of work to be done to improve water quality in the Charles, Mystic and Neponset Rivers in the future, says Deborah Szaro, acting EPA Region 1 administrator. But these annual report cards are also a testament to how much cleaner these rivers — and Boston Harbor, which they all flow into — are today than they were 30 or 40 years ago.
“In the 1980s, Boston Harbor was really one of the most toxic harbors in America,” she says. “The wastewater treatment plants were falling apart. They were dumping bacteria and toxins off the shores of Winthrop and Quincy. Sewage overflowed regularly onto our beaches. Fish had tumors and other diseases. Suffice it to say, no one wanted to go anywhere near the water.”
But following several federal lawsuits and billions of dollars of cleanup, Szaro calls the remediation of Boston Harbor “undoubtedly one of the greatest environmental success stories in the country." And now, she adds, “we're focusing our attention on more upstream areas, on the three major rivers that feed into the harbor.”
The EPA first launched the Charles River water quality report card 25 years ago so citizens could track the cleanup progress. The agency began issuing grades to the Mystic River in 2007, and this year added the Neponset. Citizen scientists with local watershed groups collect data from the rivers and submit the results to the EPA, which calculates a grade based on a three-year rolling average of bacteria levels.
“The report cards are really a tool to drive action on further cleanup,” Szaro says. “This is really important on the segments of the river where water quality improvements are needed, and especially in environmental justice neighborhoods that have been disproportionately impacted by pollution and don't have the same resources as other more affluent communities [for cleanup efforts].”
Earlier this week, Gov. Charlie Baker wrote to the EPA in support of listing the lower Neponset River as a federal superfund site. This part of the river, which runs through Milton, Hyde Park, Dorchester and Mattapan, has a long history of industrial pollution, including PCBs. (Whether the Neponset gets listed is technically unrelated to the water quality report cards, which measure E. coli, not toxins in the sediment.)
Szaro of the EPA, who grew up near Hyde Park, says she remembers being told as a child to stay away from the Neponset River because it was so dirty — she also recalls many floating objects in the water and a noxious smell emanating from it. She says the regional office is advocating for superfund site designation with EPA headquarters.
She adds that she hopes all three major rivers in the Boston area will be places where people "can enjoy the natural beauty, take part in nature, recreate and and just get a break from daily life by enjoying the scenery."
2020 Charles River Grades:
Upper Watershed (Hopkinton to Medfield): 85%, B+
Upper Middle Watershed (Sherborn to Dedham): 94%, A
Lower Middle Watershed (Newton to Waltham): 89%, A-
Lower Basin (Watertown to Boston): 71%, B-
Stop River (Medfield): 87%, A-
Muddy River (Boston): 43%, D-
2020 Mystic River Grades
Upper Mystic Lake: 93.21%, A
Mystic River: 81.85%, B+
Meetinghouse Brook: 70%, C+
Malden River: 59.6%, C-
Aberjona River: 58.78%, C-
Little River: 51.02%, D+
Mill Brook: 48.57%, D
Alewife Brook: 46.46%, D
Winns Brook, 45.71%, D
Island End River: 96.88%, A+
Chelsea River: 90.91%, A
Mystic River: 79.81%, B
Belle Isle Inlet: 78.08%, B
Mill Creek, 32.86%, F
2020 Neponset River Grades
Turner Pond: 98.6%, A+
Crack Rock Pond: 97.3%, A+
Ganawatte Farm Pond: 96.8%, A+
Willet Pond: 96.1%, A+
Massapoag Brook: 89.7%, A-
Mill Brook: 89.5%, A-
East Branch: 86.7%, A-
Beaver Brook: 86.3%, A-
Steep Hill Brook: 86.2%, A-
Spring Brook: 81.8%, B+
Mother Brook: 79.8%, B
Upper Neponset River: 76.8%, B
Mine Brook: 76.0%
Ponkapoag Brook: 75.7%, B
Lower Neponset River: 74.4%, B-
Beaver Meadow Brook: 71.8%, B-
Pecunit Brook: 70.6%, B-
Hawes Brook: 69.3%, C+
Traphole Brook: 63.0%, C
Pine Tree Brook: 62.1%, C
Pequit Brook: 58.4%, C-
Germany Brook: 50.1%, D+
Purgatory Brook: 45%, D-
Unquity Brook: 31.4%, F
Meadow Brook: 24.1%, F