Advertisement
Five Myths About Massachusetts Health Reform (By A Former Romney Executive)

Amy M. Lischko
Guest Blogger
Myth Number 1: Uninsured rates in Massachusetts are 2% compared to nation’s 16%
This is like comparing apples to oranges since the 16% is from the federal current population survey and the 2% from the state’s own survey. The two surveys use different methodologies making comparisons impossible. I do not understand why people keep using MA numbers from the state survey and comparing them to the federal US numbers. Isn’t the true and legitimate comparison impressive enough? And, although I’m a fan of the state’s survey, I question the 2% number when I see the health safety net numbers on the rise.
But, for those keeping score: In 2010, US = 16.3% and MA = 5.6%...down from 2006 reported rates of 9.6%.
Myth Number 2: There has been no evidence of crowd-out in Massachusetts
According to a report from the Robert Wood Johnson Foundation, crowd-out has been defined in multiple ways but the most common definition: “compares the reduction in the share of the population with private coverage to the increase in the share of the population with public coverage due to the expansion." Citing self-reported increases in employer offer rates is interesting, convenient, and certainly serves political interests but it is not evidence of the absence of crowd-out. We have yet to see any definitive studies conducted on this issue that fully assess the cause(s) of the observed increase in public and decrease in private coverage in Massachusetts since the reform. (Various reports from Division of Health Care Finance & Policy report the numbers differently but all reports note that public coverage has grown more than private coverage.) Whether more employers are offering or not is NOT part of this calculation.
Myth Number 3: The individual mandate is responsible for lowering premiums in the individual market
By far, the single most important factor contributing to the decline in premium rates in the individual market following the reform was its merger with the small group market. Some economists like to talk about the importance of the mandate in increasing the number of healthy lives brought into the risk pool but this has had little impact on the lowering of premium rates in the individual market. Around the margins the individual mandate may have brought in some healthy lives, however, they were spread out over the different markets (CommCare, CommChoice, Young Adult and small group), and the impact of those lives vs. the merging of the markets had to be pretty small.
Myth Number 4: The 2006 reform was never about costs
Of course it was about costs! The whole idea behind Governor Mitt Romney’s exchange was to bring more transparency of health care costs and quality, more choice, and more affordable products to small businesses and individuals. I recall talking about this to national audiences around the time the reform was passed with a slide titled, “Health Care Reform: Coverage and Cost Containment.” That these elements of reform were not emphasized by the Patrick administration during the reform’s implementation does not surprise me. However, to talk about the reform as if it was never intended to address costs is simply convenient revisionist history.
Myth Number 5: The additional state cost per year of the reform has averaged $91 million a year
Huh?
Does anyone out there understand the logic of presenting the $91 million figure highlighted in the recent report by Massachusetts Taxpayers Foundation on the cost of Massachusetts’ reform? While the author uses reasonable data and assumptions, the headline conclusion, “Over the five full fiscal years since the law was implemented, the incremental additional state cost per year has averaged $91 million…” is not straightforward or very useful. Why not just talk about the not so unreasonable additional costs of reform?
Here is Table 1 from the report:
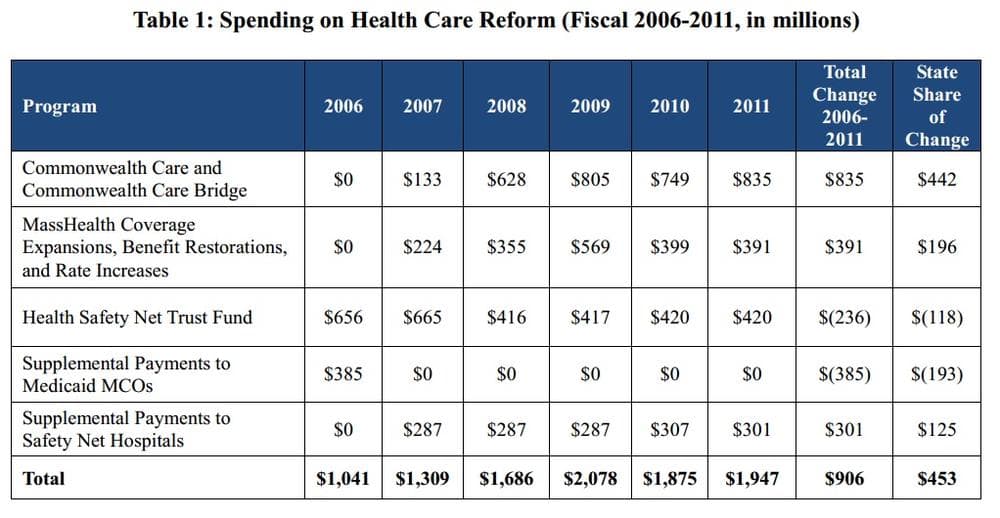
These data concur with data reported by Administration and Finance which were reported in Chapter 7 of Pioneer Institute’s recent book The Great Experiment: The States, the Feds, and Your Health Care which I co-authored with Josh Archambault. Around the edges there may be some inconsistencies (they don’t report the $25 million start-up costs for the Connector, for example) but these numbers present an accurate picture of the reform’s cost to government.
However, the conclusions could be reported in one of the following ways which readers might find easier to understand: 1) cumulative cost of the reform; 2) the average annual cost of the reform; 3) the difference in costs pre vs post reform or, 4) the total cost of insuring the low-income population.
Let’s look at each option below.
- Cumulative cost of reform: Readers may want to know how much additional costs the state and federal government have paid for Massachusetts’ reform. Comparing each year’s reform costs to the baseline year’s costs, a cumulative cost of $3.69 billion is found. The state costs are somewhat less than 50% due to increased federal participation during the recession years of SFY 2009 and 2010. So, additional cumulative state costs, if you assume federal reimbursement at 60%, are in the neighborhood of $1.48 billion.
- Average annual cost of reform: Similarly, using data from Table 1, if the total state cost of reform are summed and divided by five, an average annual additional cost over the 2006 baseline, is $738 million, with a state share of approximately $369 million per year.
- The difference in costs pre vs. post reform: can be found directly in Table 1 and is accurately reported as $906 million with a state share of $453 million. And, this represents only 1.4% of the state’s $32 billion budget. This is hardly a budget buster so why dress it up so it appears even smaller?
It is also important to keep in mind that Massachusetts was already spending a lot of money on its safety net prior to reform. So, it may be important for some analysts to add together the pre-and post numbers, which amount to greater than $2 billion per year and represents 4) the total cost of securing access to insurance for Massachusetts low-income residents.
Amy M. Lischko, Ph.D., is an associate professor of public health at Tufts University School of Medicine, a Fellow at the Pioneer Institute and former Commissioner, Division of Health Care Finance and Policy and Director of Health Policy under Governor Mitt Romney.
This program aired on April 19, 2012. The audio for this program is not available.