Advertisement
Report: The Boston Area Is Middling When It Comes To 'Inclusive Growth'
Here around Boston we talk a good deal about how the region is doing fairly well economically — but not so well for everybody.
A new report offers a bit more evidence for that narrative.
The Boston metropolitan area — a broad geographic region that includes southern New Hampshire — ranks 57th out of the 100 largest U.S. metros when it comes to so-called inclusive, or widely shared, growth, according to the Brookings Institution's Metro Monitor 2017, which was released Thursday.
The primary reason for our area's decidedly middling ranking: a median wage that fell 2.2 percent over the time period examined, which was 2010-'15. That wage figure ranks 73rd among the 100 metros.
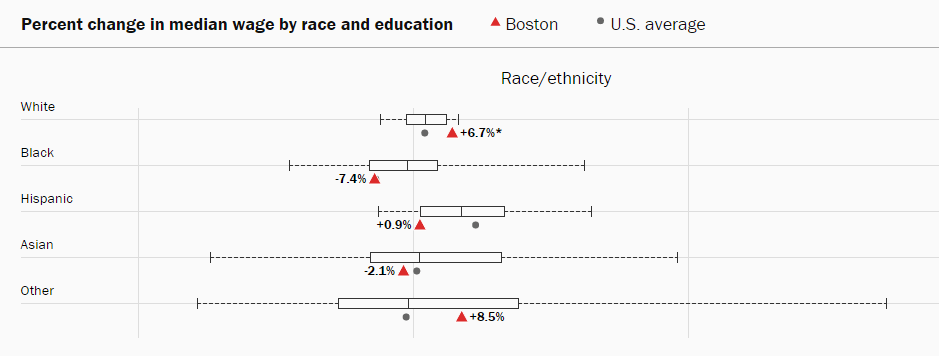
There are some significant demographic differences in the earnings data.
Have a look at the graphic below. As you can see, the median wage for Boston-area whites grew a robust 6.7 percent over the time period, while it fell for blacks and Asians, and barely rose for Hispanics.
On the other end of the "inclusive growth" spectrum is the Springfield metro. Its median wage and its employment-to-population ratio both increased about 7 percent over the time period, while its relative poverty rate fell 8.5 percent.
The Springfield area, though, is near the bottom of the list when it comes to expansion in the number of jobs overall and in gross metropolitan product.
And Greater Boston is not the only metro to struggle with inclusive growth.
Only 53 areas saw median wages rise over the post-recession time period. And, as Brookings said in its press release: "While many metropolitan areas experienced economic growth, fewer saw increases in prosperity and productivity, and even fewer made progress on economic inclusion."
Additionally, the time period examined is before the bulk of Massachusetts' recent minimum wage hikes went into effect. That pay floor rose to $11 an hour on Jan. 1.
The Metro Monitor provides a bigger snapshot than just the inclusive growth element. Over the time period, it tracks economic progress in three areas — growth, prosperity and inclusion — and with three datapoints in each of those areas. Here's how the Boston metro ranks on all those measures:
Growth - 36th
- Jobs - 48th
- Gross metropolitan product - 45th
- Jobs at young firms - 33rd
Prosperity - 29th
- Productivity - 45th
- Standard of living - 48th
- Average annual wage - 12th
Inclusion - 57th
- Employment rate - 46th
- Median wage - 73rd
- Relative poverty - 48th
So, the Boston area was 36th in growth, but 57th in inclusion. As Brookings' concludes about its findings overall: "These results suggest that economic growth alone, even growth that produces rising living standards, does not reliably assure better outcomes for all groups in a metropolitan area."
This article was originally published on March 02, 2017.