Advertisement
Fatter And Fitter: 20 Years Of Health Stats (Also, Mass. Men Lag)
Massachusetts men, forgive the nag but it appears that you're not all doing your part for the health of the state and the nation, not to mention your own wellbeing.
The quants over at the Institute for Health Metrics and Evaluation at the University of Washington have just released a great data dump on changes in the nation's health stats from 1990 to 2010, and they sum it up with this headline: "Obesity continues to rise in nearly all counties but Americans are becoming more physically active, too."
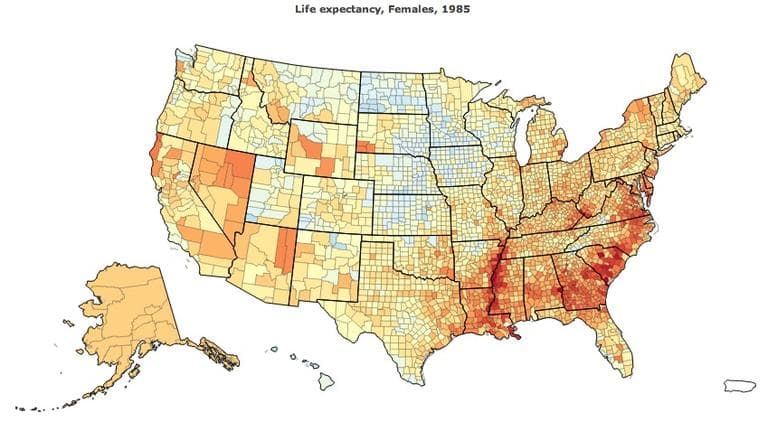
I'll get to the men on the couch, but first the daunting news for women: In many American counties, women are not living any longer than they did 25 years ago. Why not? Is rising obesity offsetting any other health gains?
Dr. Christopher Murray, the institute's director, told reporters by phone that there are two possible explanations: smoking and obesity.
It could be that obesity is having a bigger effect on women, he said, and it's known that the timing of tobacco effects differ for men and women: "Tobacco had its biggest impact on men a couple of decades ago," he said, "and we're now seeing the peak [effect]s of tobacco smoking on women three or four years ago." Those are "two pretty clear associations we see in trying to understand this differential pattern for men and women."
Now for the Massachusetts men: On that fun interactive map, if you set the sex to "male" and the display to "Physical activity (change)" and then scroll over Massachusetts, it will tell you the percentage change in the prevalence of "sufficient physical activity": Overall, American men are down .5%, and Massachusetts men on average are down 1.3%.
Women, on the other hand, are looking like fitness goddesses:
The state average for women is up 4.8% and the national average is up an even more whopping 5.9%. Go, girls, and please bring along your brothers when you do. And by the way, what do you think is going on? Is it that women tend to pay more attention to health messages, and try to live by them? Or what?
Dr. Murray said that he sees the statistics overall as cause for optimism, because some communities have shown really dramatic improvement in their health statistics, showing it can be done.
"The key thing we're observing is there's a lot of potential to improve health by addressing diet, tobacco, physical activity, high blood pressure," he said, and "there are communities within the U.S. that have proved that we can make those sorts of changes within the U.S. setting."
"It is possible to see that sort of progress and that's why we take these findings and view them rather optimistically, that there is a demonstrable potential to have the U.S. fare better."
Some inspiration from the study's press release:
Counties in Kentucky, Georgia, and Florida all reported big gains in physical activity. The highest increase for men was in Concho County, Texas, up from 41.4% in 2001 to 58.2% in 2009, and women in Morgan County, Kentucky, increased from 25.7% to 44%. For the study, sufficient physical activity was defined as 150 total minutes of moderate activity per week or 75 minutes of vigorous activity.
So if many of us are still getting fitter, why are we also getting fatter? No mystery to me — more like the story of my life — but here's Dr. Murray's answer to reporters:
Communities that have most increased physical activity have seen smaller gains in obesity, he said, but "I think the interpretation of why we haven't seen declines is that calorie imbalance is such that there are still more calories coming in at the community level than calories going out through physical activity. And to progress in reducing obesity is going to require reductions in intake and/or higher levels of physical activity."
Sigh.
More from the press release:
Because of the increase in obesity over the last two decades, high body mass index (BMI) is now the third-leading risk factor to health, according to “The State of US Health, 1990-2010: Burden of Diseases, Injuries, and Risk Factors”—another IHME study published today, in the Journal of the American Medical Association. The toll posed by obesity was also cited in another new IHME study, on life expectancy.
And better news:
More people are running, biking, and exercising in other ways in hundreds of US counties, according to new research from the Institute for Health Metrics and Evaluation (IHME) at the University of Washington.
The rise in physical activity levels will have a positive health impact on Americans by reducing death and chronic disability from cardiovascular diseases and diabetes. But the trend has had little impact so far on stopping the rising tide of obesity. As physical activity increased between 2001 and 2009, so did the percentage of the population considered obese. Obesity and risk factors from poor diets, smoking, and high blood pressure all are causing a drag on US life expectancies, which increased slowly compared to the country’s economic peers between 1985 and 2010.
“Around the country, you can see huge increases in the percentage of people becoming physically active, which research tells us is certain to have health benefits,” said IHME Director Dr. Christopher Murray, “If communities in the US can replicate this success and tackle the ongoing obesity impact, it will see more substantial health gains.”
And just a little provincial note: Congratulations to the romping women of Barnstable county...
Which counties were the most active and least active for women in 2011?
Most active: Least active:
Routt, CO 74.7% Issaquena, MS 28.4%
Marin, CA 74.2% Noxubee, MS 29%
Teton, WY 72.7% Quitman, MS 29.1%
Pitkin, CO 72.4% Tallahatchie, MS 30.7%
San Juan, WA 71.6% Haywood, TN 30.7%
Summit, UT 69.6% Tunica, MS 30.7%
Eagle, CO 69.6% McDowell, WV 30.8%
Barnstable, MA 69.2% Humphreys, MS 30.9%
Benton, OR 69.1% East Carroll, LA 31.2%
Rio Blanco, CO 68.8% Taliaferro, GA 31.3%
Readers, if you play with the data at all, please let us know if you find anything else of interest. The map is here.