Support WBUR
Harvard Study: Better Police Reports On Bike Crashes Could Save Lives
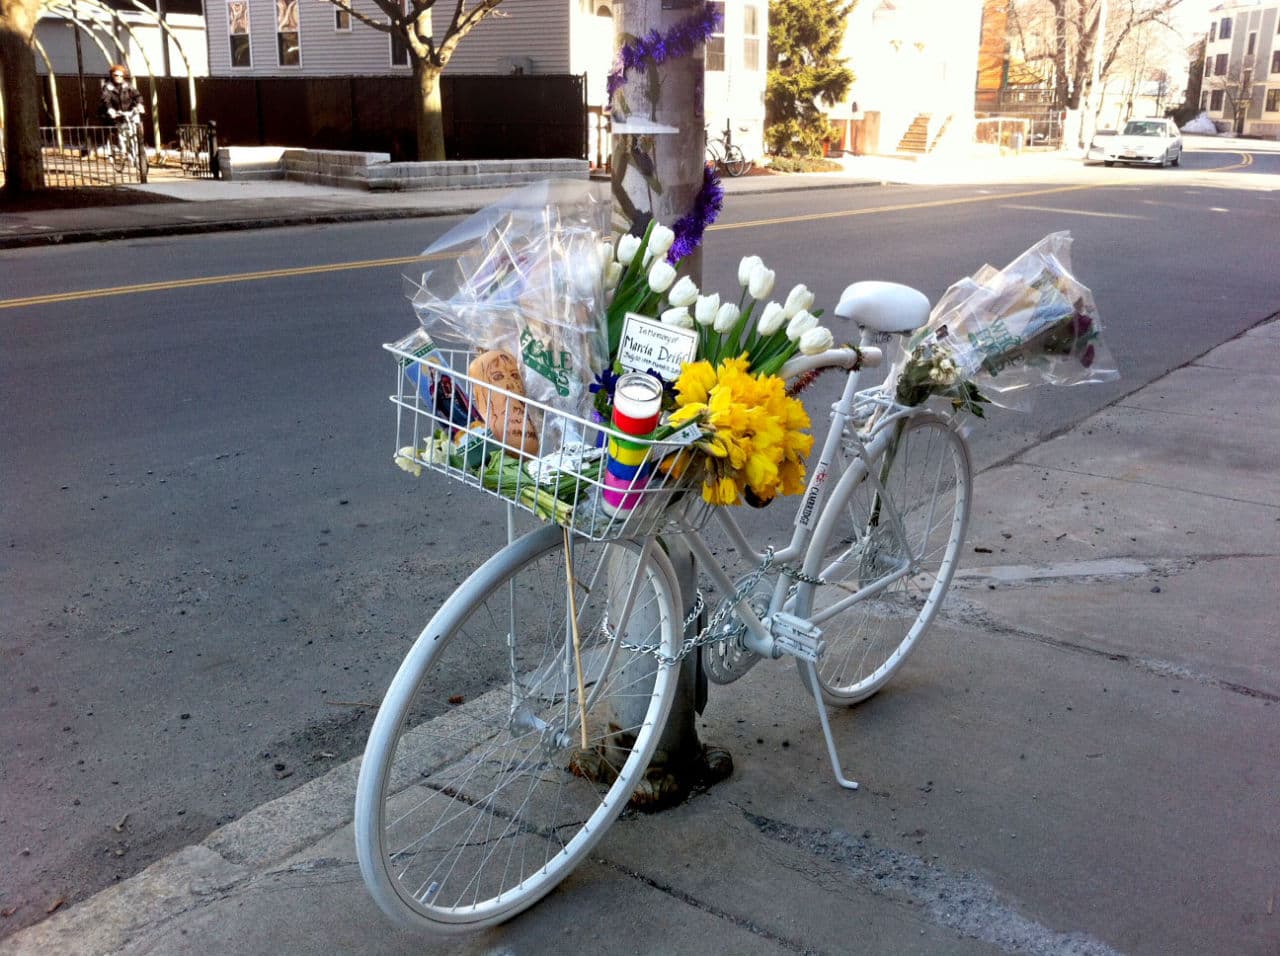
Last month, Marcia Deihl, a songwriter and community activist out for a bike ride on the first warm day after a brutal winter, was struck and killed by a dump truck outside a Whole Foods in Cambridge, Massachusetts. A white "ghost bike" now memorializes her death.
Aspiring photojournalist Christopher Weigl, just 23, was also killed in a bike accident: Wearing a helmet, and traveling in the bike lane near Boston University, Weigl collided with a 16-wheel tractor trailer when the truck made a wide right turn in the winter of 2012.
And less than a year before that, MIT graduate student Phyo N. Kyaw sustained fatal injuries when his bike collided with a truck in a busy Cambridge intersection.
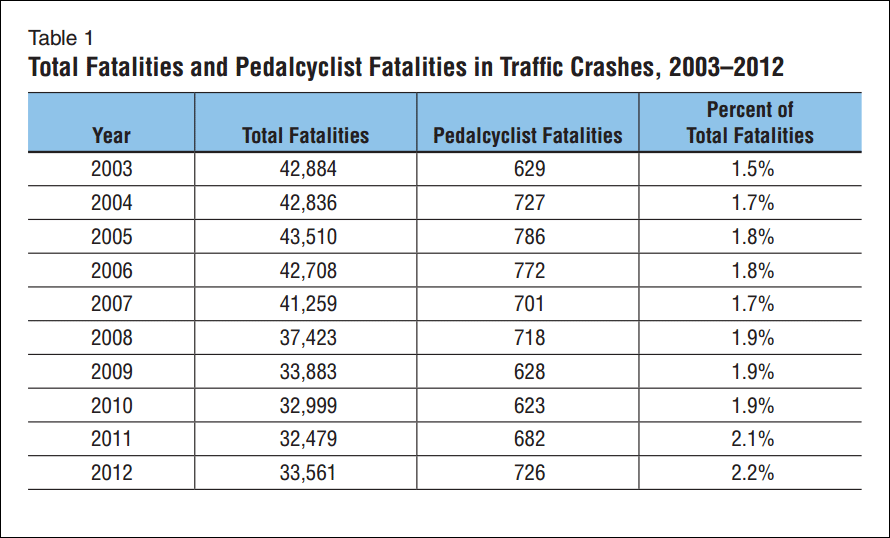
These deaths happened close to home: where I work, shop, ride with my kids. And they underscore two truths: There are more cyclists on the road, and more of them are getting hurt in accidents, some fatal. The number of commuters who bike to and from work rose about 62 percent nationwide from 2000 to 2013, one report found. With those numbers comes added risk: 726 bicyclists were killed and 49,000 bicyclists injured in 2012, according to the National Highway Traffic Safety Administration.
As a driver, you don't need a research study to tell you that bikes are everywhere, whether you're in Boston, New York or Seattle. But you do need research, and data, to help fix the problem — that is, reduce the number of accidents and deaths.
Cities, towns, planners and private businesses can't move forward building safer cars and safer bike environments until they learn more precisely how bike accidents happen. Is a truck's wide turn to blame? A taxi door opening at the wrong time? These seemingly small details of crashes are critical, says Anne Lusk, a research scientist in the Department of Nutrition at the Harvard School of Public Health.
That's why Lusk and her colleagues have issued a blueprint of sorts for improving bike-vehicle crash reports produced by the police; their findings are published this week in the journal Injury Prevention.
After studying hundreds of hopelessly low-tech police reports used to record bike accidents, Lusk and her colleagues are making a nationwide plea: They're calling on police in all states to step into the modern era and improve reports on crashes involving vehicles and bicycles. Currently, Lusk said in an interview, the details on crashes are handwritten and drawn by police on paper, with few bicycle-specific codes or diagrams.
Lusk offered one example: Currently, a crash report from Massachusetts shows “two vehicles” drawn. One of the “vehicles” is then coded as a “pedal cyclist” but there is no drawing on the template of a bicycle to show which side of the bike was hit.
Police have been recording bike crashes since the introduction of the bicycle in 1890, researchers note.
Now it's time for a major upgrade. Lusk says police should "use electronic tablets with dropdown menus that have specific vehicle/bicycle codes, for instance, whether the bicyclist was riding inside a painted bike lane when hit, or whether the cyclist crashed into a driver’s open car door. The dropdown menu would also include other specific data like a coded vehicle picture and a coded bicycle picture. This information could then be automatically loaded onto spreadsheets for later analysis, Lusk said.
We've got self-driving cars and myriad bike-related technologies — from GPS to Fitbit — Lusk said, "but until this, there's been no introduction of a systematic, highly technological tool for police to document bicycle-vehicle crashes.
"The goal here," Lusk added, "is to develop the world's best database for vehicle/bicycle crashes. With good data, the environment could me made safer for car drivers and for cyclists." This, in turn, could encourage more biking, with all of the related health and environmental benefits.
"This is a big deal," Joshua Zisson, a Boston lawyer who specializes in bike-related cases and runs BikeSafeBoston, a website about bike law, said in an email. "The proposed changes would make a huge difference in determining what happened in a crash, and who was at fault. In the three years since I started my bike practice, I’ve seen hundreds of police reports describing bike vs. motor vehicle crashes, and I would only consider a handful of them to be well written and properly descriptive. The majority range from bad to absolutely awful (i.e., too vague, too brief, poorly illustrated, not illustrated). Giving officers better tools to describe a crash with a bike will almost certainly allow them to do a better job, as they won’t have to force their description of events into a framework designed for cars."
The study was paid for by Nissan, the car company. Lusk responded: "Nissan suggested that what was very helpful for them as a car manufacturer was to have data to explain crashes with bicyclists...this was not about liability at all. The sole objective is improving safety, for the peace of mind for the driver as well as the cyclist. No driver wants to hurt or kill a bicyclist. The truck drivers who kill bicyclists live with that for the rest of their lives. How can we reduce or eliminate that burden? That truck driver never wanted to kill that woman coming out of Whole Foods. Can this crash reporting lessen the risk? Yes."
Here are more specifics from the Harvard School of Public Health news release:
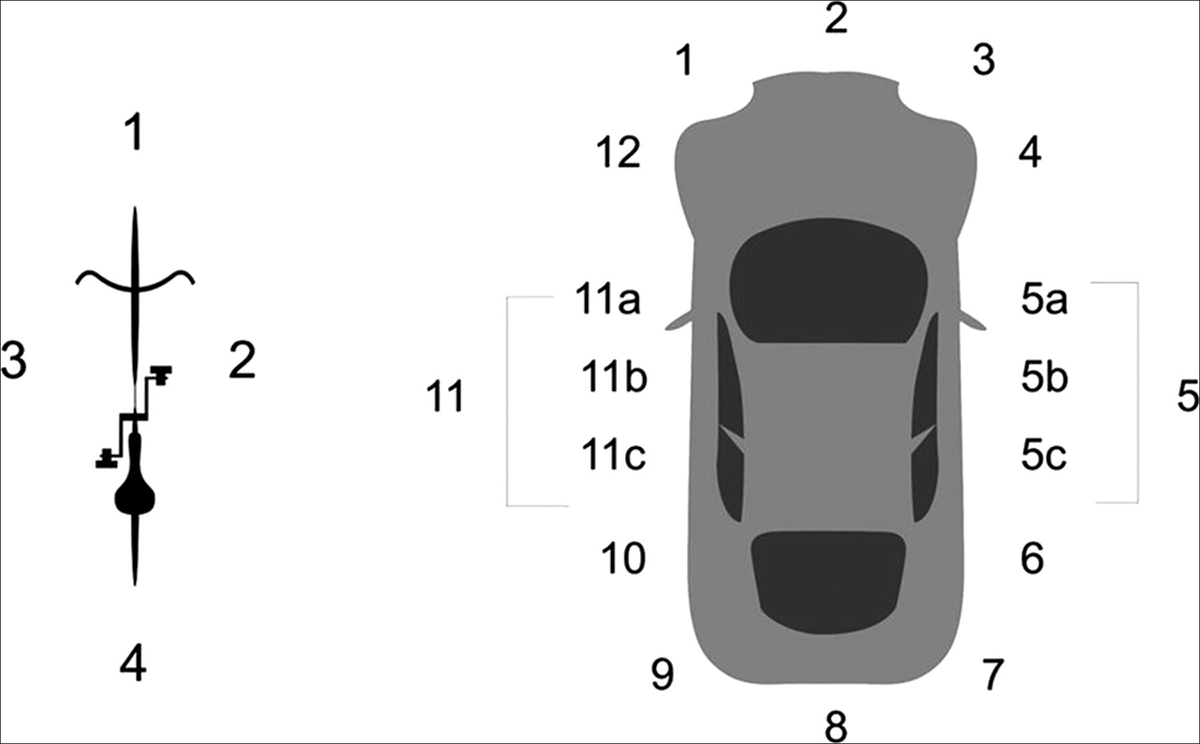
The researchers reviewed police crash report template forms from 50 states and the Model Minimum Uniform Crash Criteria (MMUCC) template. Lusk and her colleagues learned that the forms asked for few details about bicycles. What’s more, the researchers suggested improvements that could be made regarding crash diagrams. Vehicles are drawn like two rectangles crashing but a bicycle is like a line that can crash into an opened door or a mirror.
To determine which bicycle-crash-scene codes should be considered for an electronic tablet, the researchers selected 300 vehicle/bicycle crashes that included diagrams out of 3,350 vehicle-bicycle crash reports in the New York City area in 2011. An equal number of crashes were selected for streets without bike infrastructure, with sharrows, with painted bike lanes, and with barrier-protected cycle tracks.
The researchers redrew all 300 crashes using Google street views and the police report text and diagrams. New codes were developed and these new data points about each crash were entered into the existing spreadsheet for all of the crashes. Because the current spreadsheet includes if the bicyclist had a minor or severe injury, a test, with minor injuries as the control, was able to be conducted to assess the value of having these new bicycle-crash-scene variables. If bicycle variables were entered into the existing crash scene spreadsheet, other researchers could also compare minor and severe injury of bicyclists in the different road environments.
Pete Stidman, executive director of the Boston Cyclist's Union, said this city is way ahead of many others when it comes to data on bicycle crashes. For instance, the group has been working to create its own version of an interactive crash map that uses crash data from the group's collaboration with the Boston Area Research Initiative (BARI), the Boston Police Department and others. BARI's current map can be used to determine which parts of town are most dangerous; but Stidman says the Bike Union's map will have more indications on injuries and what is causing the crashes.
Lusk, of Harvard, says the existing crash map data helps to show that, for example, "Massachusetts Avenue is not safe just before the bridge. The map from the city of Boston also shows that the Western Avenue cycle track is the safest place to bike in Boston."
Such geographical information is useful because it points to where changes in the environment could help, she says, but the improved crash reports that she proposes would do more:
The data that would be generated using our newly suggested multiple codes (that would be entered into the crash spreadsheet) would contain far more details about each individual crash. Then, similar to the cluster of crashes in the crash map showing a pattern, research could be conducted with our newly proposed data to show that, as one example, bicyclists often crash into the opened back car door of a taxi. The recommendation could then be to have taxis that are vans with sliding doors...
We had wanted this to be crash data generation that is universally applied across the U.S. Then, analysis could be conducted as a comparison using data from a city and a rural community. Analysis could also be conducted using data from all crashes across the U.S.
Our research is but one step toward obtaining far more detailed vehicle/bicycle crash data and having it readily available for analysis.
Readers, bikers, do you think this will help? Any other related proposals out there? Let us know.