Advertisement
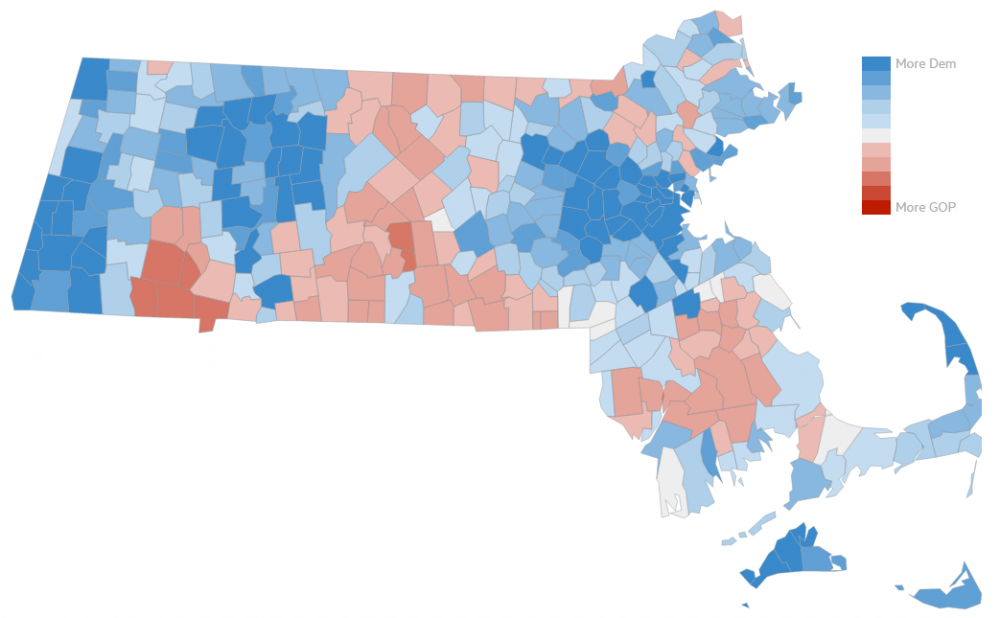
A Closer Look At The Mass. Map Of Clinton-Trump Results

Massachusetts' 11 electoral votes went to Hillary Clinton, who defeated eventual-President-elect Donald Trump here by about 27 percentage points.
That's right in line with recent presidential results in Massachusetts. In the four prior races, the Democratic nominee has won the state by 23 to 27 points.
Here are the state's overall results:
- Clinton: 60.8% | 1,964,768 votes
- Trump: 33.5% | 1,083,069 votes
- Gary Johnson: 4.2% | 136,784 votes
- Jill Stein: 1.45% | 46,910 votes
We've been playing around with our town-by-town map (the interactive version is embedded below), and wanted to highlight a few more numbers.
As you can see from the map above, Trump did best in central Massachusetts and on the South Shore (along with winning some small towns in the southwestern part of the state). Greater Boston and western Massachusetts heavily favored Clinton.
To us, the Clinton-Trump map recalls a post WBUR analyst Steve Koczela wrote back in 2014, on the state's distinct political regions, and how that partisan landscape has changed over the years.
Steve wrote:
Recent statewide election results for governor and U.S. Senate show a state divided into three regions. Greater Boston and parts of Metro West are becoming reliably blue. Outside Boston runs a collar of red, bleeding into the central region of the state and down into the south coast. The red stops around I-91 and the Pioneer Valley, and the western third of the state is deep-blue, from Springfield arcing north and west to the New York border.
Here's a look at where the two candidates performed best, percentage-wise. Clinton's margins were, of course, bigger — and in bigger communities:
Top 5 communities for Trump:
- Tolland: 61.9% Trump | 32.9% Clinton
- Russell: 58.5% Trump | 33.9% Clinton
- Blandford: 58% Trump | 36.8% Clinton
- Southwick: 57.3% Trump | 36.1% Clinton
- Granville: 57.2% Trump | 35% Clinton
Top 5 communities for Clinton:
- Cambridge: 89.2% Clinton | 6.5% Trump
- Provincetown: 88.1% Clinton | 8.8% Trump
- Brookline: 84.9% Clinton | 11.1% Trump
- Somerville: 84.6% Clinton | 10.5% Trump
- Amherst: 84.1% Clinton | 8.6% Trump
Boston is not far down that list. Nearly 82 percent of the city's voters backed Clinton, compared with just 14 percent for Trump.
And what about the most divided communities? Here are the five communities where the percentages between the candidates are smallest:
- Bellingham (.3): 46.7% Trump | 46.4% Clinton
- Paxton (.4): 46.6% Clinton | 46.2% Trump
- Plainville (.4): 46.3% Trump | 45.9% Clinton
- Wrentham (.5): 46.7% Clinton | 46.2% Trump
- Rockland (.6): 47.2% Clinton | 46.6% Trump
On a raw vote level, small-town Paxton, in central Massachusetts, was closest, as Clinton won it, 1,204 to 1,194.
Check out the map here:

