Support WBUR
See How Much Money Your Town Or City Gives, And Gets From, The Lottery
Every year, about a fifth of the revenue the Massachusetts State Lottery collects from those who play is handed out to the state's 351 towns and cities. While more than 300 of those communities are home to convenience stores, bars or other places where people can buy lottery products, about 40 towns — mostly small, all with populations under 14,000 -- do not sell any.
The decades-old formula the state uses to distribute lottery funds attempts to deliver more money to places with greater populations and/or places with lower property values. But it does not consider whether a municipality sells lottery products — or how much it sells. That means that some cities and towns are relative "winners," gaining more funds compared to their sales, while other places stand out as "losers," or places where a lot of money is spent on the lottery and relatively little comes back.
Our interactive map, below, highlights those disparities.
Specifically, it shows how much money each town or city put into the pool of state lottery revenue over the past five years, from 2013 to 2017. Think of that as "money out." It also conveys the dollar amount each municipality received in lottery revenue in that same period. That's "money in."
Just by looking at the colors on the map, you can see which towns and cities have fared better than others when it comes to money in versus money out. The colors reflect the ratio between lottery sales that took place in a community, and the lottery revenue it received. Most places, those in beige, are in the same middle-of-the-pack range, but there are outliers. The greener the community, the more that ratio worked in its favor; the redder the town or city, the worse it fared.
As you can see, over the last five years, Boston retailers sold about $2.7 billion in lottery products and received about $850 million in lottery revenue. So for every $3.23 that Boston sold in lottery products, the city got a dollar back.
The town of Harvard and the island community of Nantucket are on opposite ends of the spectrum, when it comes to this lottery distribution system. For more on those towns — and expert opinion on this formula — go here.
Below the interactive are further instructions on how to use it. Note: This map is easier to use on desktop than on a mobile device.
How To Use The Map
In this interactive, there are two ways to see the lottery "money out" and "money in" ratio for each Massachusetts town or city.
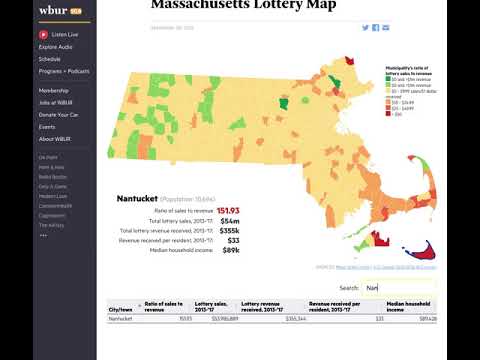
First, you may click on any municipality and below the left-side of the map the following data appear, in this order:
- the name of the community;
- its population;
- the community’s ratio of sales to revenue received;
- total lottery sales from 2013 to 2017;
- total lottery revenue received in those years;
- lottery revenue received per resident in that period;
- and its median household income.
The other way to search this map is by using the search bar that sits below it on the right-hand side. Simply type in the name of the community you would like data for, and the data below the map on the left side will appear, as well as a row of cells that correspond to the column key.
Below, a video shows how to use the map and shows results for Boston, Nantucket and Harvard:
Lisa Creamer is a digital editor for WBUR. Jeff Kelly Lowenstein is an investigative journalist who teaches at Grand Valley State University. He is the project coordinator for the Gaming the Lottery project, an international collaboration involving student and professional journalists from Africa, Europe, Latin America and the United States.