Support WBUR
A new state study shows where solar is most suitable in Mass. — including your home
For Massachusetts to meet it clean energy goals, the state needs to build between 25 and 35 gigawatts of solar capacity by 2050. Currently, there are about 3 gigawatts installed — so it’s a tall order.
But according to a new study from the state's Department of Energy Resources, there’s more than enough suitable land (and rooftops) to build what the state needs without compromising sensitive environmental areas, farmland and other valuable natural resources.
The report finds that the state could theoretically put up to 506 gigawatts of solar on rooftops, over parking lots or on ground-mounted installations. However, only 52 of those potential gigawatts are deemed “top-rated,” meaning they scored well among six criteria, like whether the parcel serves as critical habitat for animals or would require costly electrical infrastructure upgrades to support solar development.
“With the study results, we can be strategic about where and what kinds of solar we deploy,” Elizabeth Mahony, commissioner of the Department of Energy Resources, said in a statement. “This tool allows us to identify pockets where the most suitable solar potential is, and direct investment and resources towards prioritizing solar in those areas.”
The study is the first time the state has analyzed solar capacity at this granular of a level. To help make the information useful for municipalities and developers, the researchers also created a mapping tool that shows where solar could be installed with the fewest negative consequences.
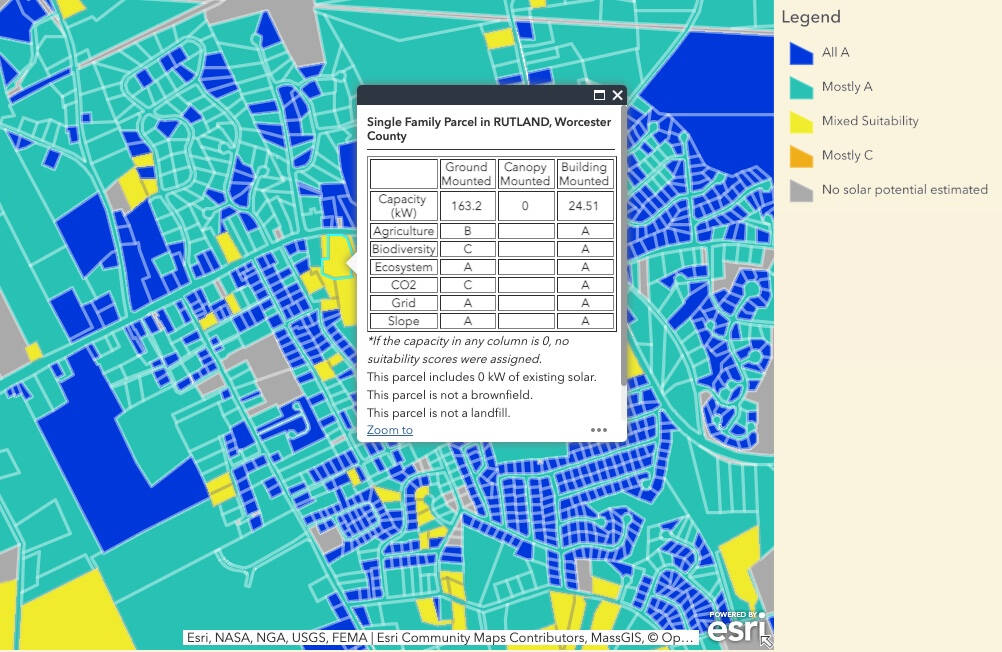
The interactive map allows users to look up individual parcels of land and see how appropriate they might be for the three types of solar development: rooftop, canopy or ground-mounted.
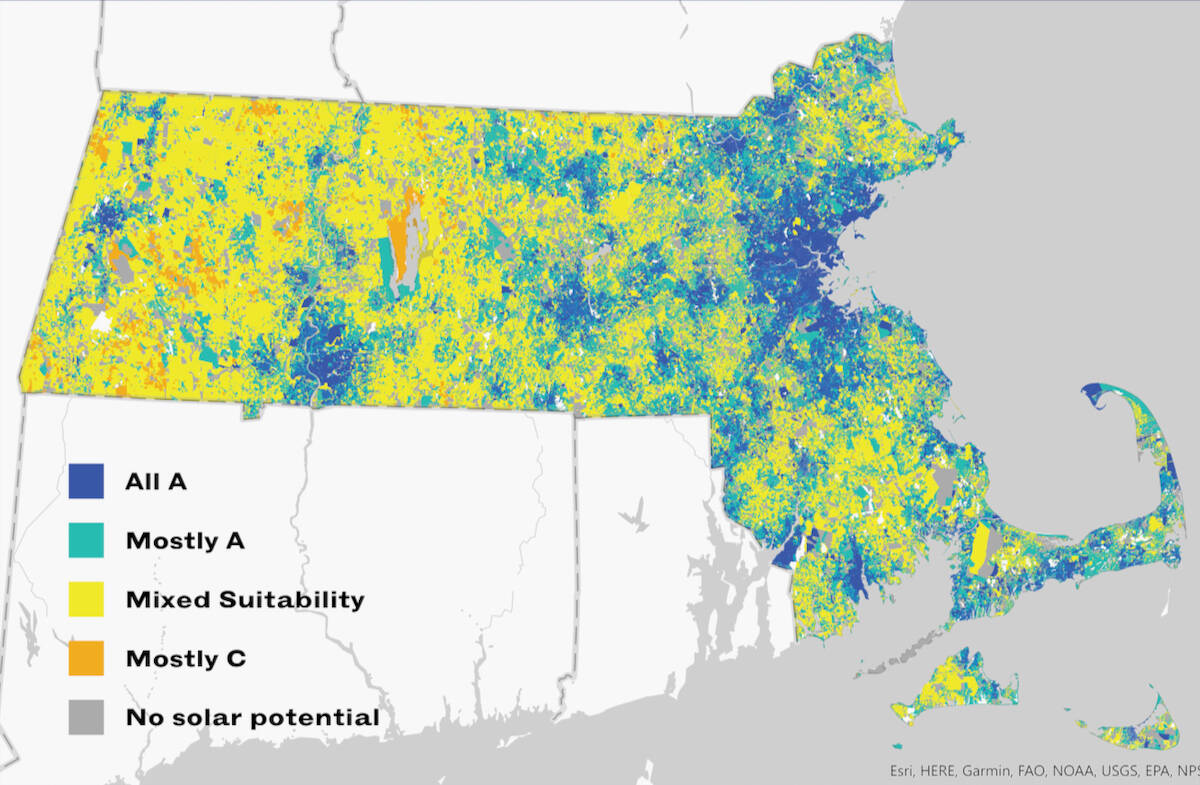
On the main map, each property is color-coded to reflect the parcel’s overall solar potential. If you click on a parcel, a pop-up box shows its suitability for the three types of solar, which is based on the six criteria:
- Agriculture: Is it used as farmland or does it have prime agricultural soils?
- Biodiversity: Does this area support important wildlife?
- Ecosystem: Is it an area of critical environmental concern?
- CO2: How much carbon dioxide that's sequestered in trees or the soil would be lost if solar is built?
- Grid: How close it is to an electrical substation, or how expensive would it be to connect it to the grid?
- Slope: Is it too hilly for ground-mounted or canopy solar, and if the land slopes, is it facing the right direction?
You can also search by the six criteria if you click on the tab labeled “suitability maps” near the top of the website. If you play around with the map, you’ll see that some parcels have no rating and are grayed out. These parcels have been deemed unsuitable by the state for a variety of reasons. The land may be protected from development or too small to host a solar array, for example.
While the map is quite granular in its analysis, state officials are quick to caution that it is not intended to be prescriptive. The results are not a recommendation for where solar should be installed. Many athletic fields and public parks, for instance, are deemed “top-rated” but are very unlikely to be developed for solar. And some homes with high solar potential may not be good candidates in reality because the slope of the roof isn't ideal or there are big trees nearby.
The purpose of the map, rather, is to help municipalities, utilities, developers and state agencies identify areas that may be best suited for various types of solar so they know where to do further analysis.
To give an example of how this could be used, imagine city planners were looking at the map and saw that one parking lot in town has an A-rating, while another lot on the other side of town has a C-rating because it sits several miles from an electrical substation and would require costly grid upgrades to be feasible. The planners now know where to direct their attention and resources.
“These results should inform the development of equitable solar projects and policy to better serve and support environmental justice communities,” Rebecca Tepper, Energy and Environmental Affairs Secretary, said in a statement. “Having identified where the most suitable potential is, we can now engage with these communities to support their clean energy goals, priorities, and access.”
The study is also clear that much of the state's solar power will need to come from small and large ground-mounted installations. Though rooftops in the state could theoretically contribute about 40 gigawatts of capacity — with canopies over parking lots contributing another 14 gigawatts — state officials say a mix of solar types is ideal.
"There are a lot of competing desires and factors for roofs," Mahony said. Many homes would need a roof replacement before solar could be installed, which is costly. "Also we are trying to electrify everything, so we have to figure out where to put equipment for that, particularly on commercial roofs."
She added that cost was a big consideration for state analysts too. There are economies of scale that come with building large solar installations, and if developers are strategic about where they place them, it may be possible to avoid many costly electrical grid upgrades.
Another purpose of the mapping tool is to help inform decisions about where large — and often controversial — solar installations could be placed so they have the least impact on communities and ecosystems, state officials said.
Massachusetts has installed a lot of solar panels in the last few decades. According to the state, there were 0.003 gigawatts of solar capacity in 2008. Today, there’s about 3 gigawatts of capacity, with approximately 0.3 new gigawatts being installed annually. (To give a sense of scale, the average rooftop solar installment is about 5 kilowatts. There are 1 million kilowatts in a gigawatt.)
To meet the 2050 goal, the new study says that the state needs to triple or quadruple the rate at which it adds solar.