Support WBUR
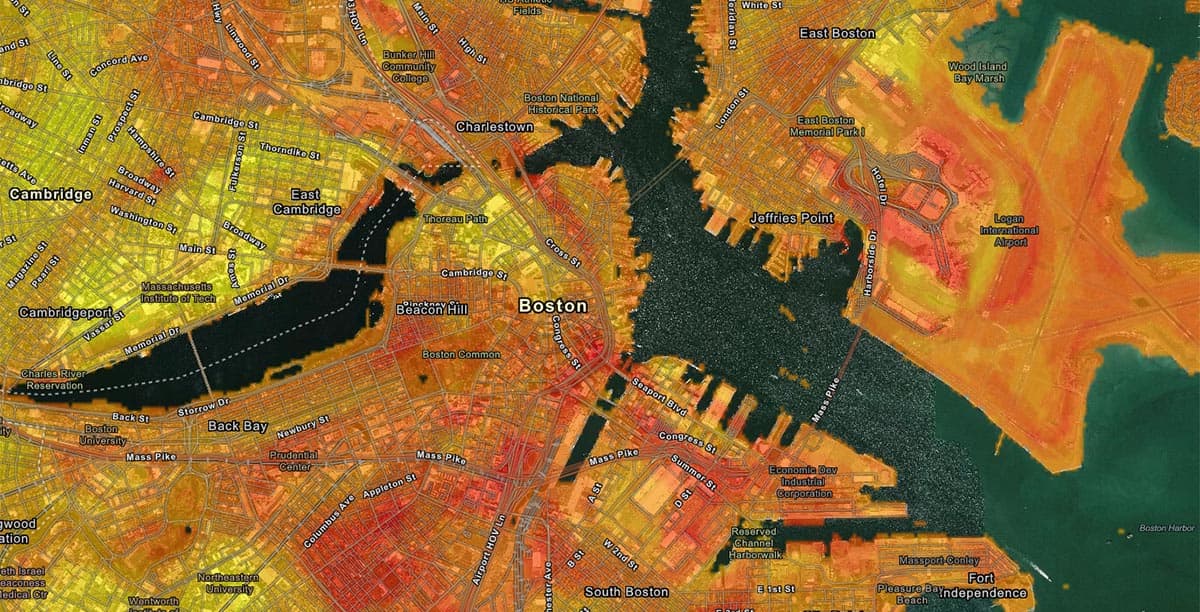
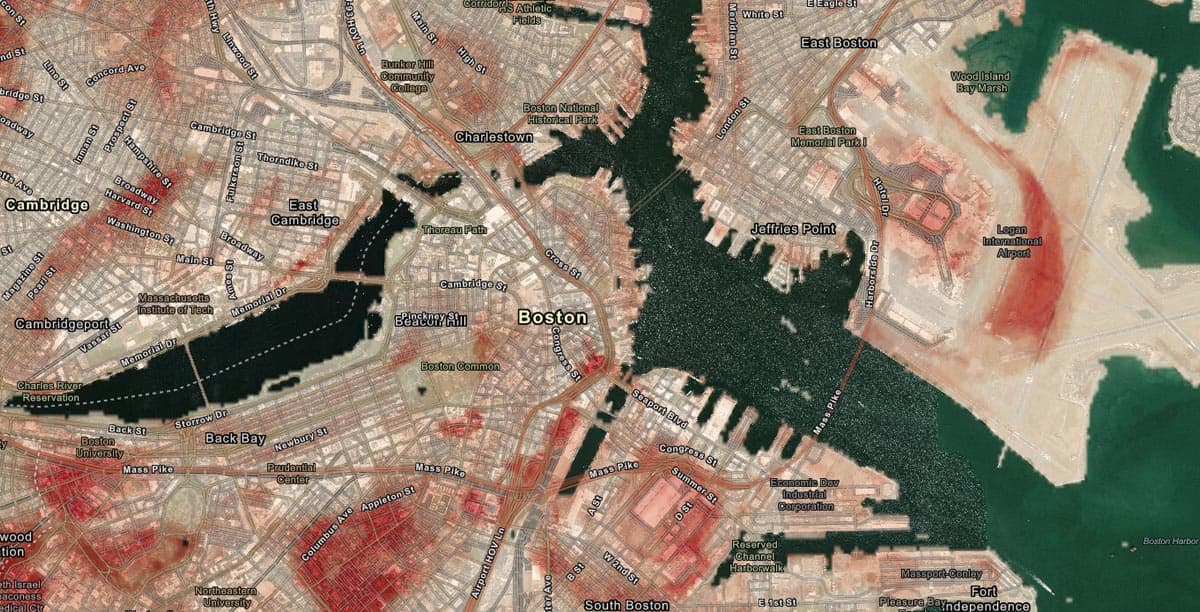
Mapping Boston Hot Spots, Block By Block
While you’re layering on sweaters and pulling out winter coats, many in the urban planning world are thinking about heat. That's because cities — with all their buildings and pavement — tend to get hotter than surrounding areas during the day, and stay hotter at night.
Extreme heat can be dangerous, even deadly. It currently kills hundreds of Americans every summer and sends tens of thousands more to the emergency room. And climate change is making the problem worse — last July was the hottest on record. Boston currently experiences about a dozen days over 90 degrees every summer. By 2100, the city could get 90 days above 90 degrees, making it feel more like Birmingham, Alabama.
This coming change has public health officials worried. But in order to prevent heat-related illnesses, cities and communities first need to know exactly where the hot spots are. Last summer, the Museum of Science embarked on a citizen science project to do just that.
On some of the hottest days during July and August, about 50 volunteers drove predetermined, carefully mapped loops in 10 areas around Boston, Cambridge and Brookline with a long white contraption jutting out from their car. The device resembles a selfie stick, but it is actually a high-tech thermometer with GPS that allows analysts to map hot spots down to a specific street corner, where even the shade of a big tree matters.
Most heat maps use satellite data to plot surface temperature. What makes this project unique is that the sensor is collecting both temperature and humidity data, and it's doing it about 5 or 6 feet off the ground. As a result, the project will capture how we actually perceive heat.
The other thing that makes this project unique is that volunteers drive the same loop three times in one day — at 6 a.m., 3 p.m. and 7 p.m. — in order to measure which areas heat up the most and least, and which areas retain their heat overnight.
"From a health perspective, it’s the evenings that tend to be problematic for people — especially during a heat wave, where you have those consecutive nights where it just doesn’t cool down," says David Sittenfeld, manager of the Forum Program at the Museum of Science. "And if city planners know that there is an area that is hot and staying hot over the nighttime, there’s things that a community can do to remain resilient."
The heat mapping project is funded by the National Oceanic and Atmospheric Administration, and has been done in a few other cities so far: Richmond, Virginia, Washington, D.C., and Baltimore, Maryland.
"We're hopeful that this is a stepping stone to doing maybe 20, 50 or 100 cities in future years — ultimately with the goal of mapping all the cities in the U.S.," says David Herring, manager of NOAA's Climate Program Office. "[It's] a great way to help cities understand what is their exposure to extreme heat, and then to move right into the ‘what can we do about it?’ conversation."
Cities might not be able to stop temperatures from rising, but there's a lot they do to prevent heat-related illness and death: planting trees, opening community cooling centers, even strengthening electrical infrastructure to keep the air conditioning on during heat waves.
"If the city agencies really know on a block-by-block basis where the problems are going to be, they can devise solutions that are both geographically relevant and that are helpful for that local population," says Jonathan Levy, professor of environmental health at Boston University. "I think the really exciting thing about what the Museum of Science is doing is engaging the public in collecting data, [and] then also teaching people about the importance of urban heat at the same time."
And while we're all susceptible to heat, specific populations are disproportionately affected.
"The people who are most vulnerable to the effects of urban heat tend to be those who can not afford to have or to use air conditioning, people who live in buildings that can heat up — often high-rise apartment buildings — and people who live in urban cores where there’s not a lot of green space or shading," Levy says. "All these things tend to cluster together and create a major risk for being exposed to urban heat [so] the more that we know about the places where these problems might occur, the more that we can target our efforts and be strategic."
This segment aired on November 25, 2019.