Support WBUR
CLIMATE CHANGE IN MASS.
You Can Explore Boston Sea Level Rise And Flooding Scenarios With This City Map
Want to see which parts of Boston have the hottest surface temperatures, or which areas will likely be subject to flood risk by, say, the 2070s?
A recently released city tool puts Boston's climate concerns on vivid display.
The city has turned the data from its massive Climate Ready Boston report into an interactive map that allows you to explore many of the report's findings and projections.
The tool allows you to layer various data sets onto the map, including sea level rise and flood risk, as well as vulnerable populations and areas of high temperatures. You can zoom in to or search specific places within city limits to see effects there.
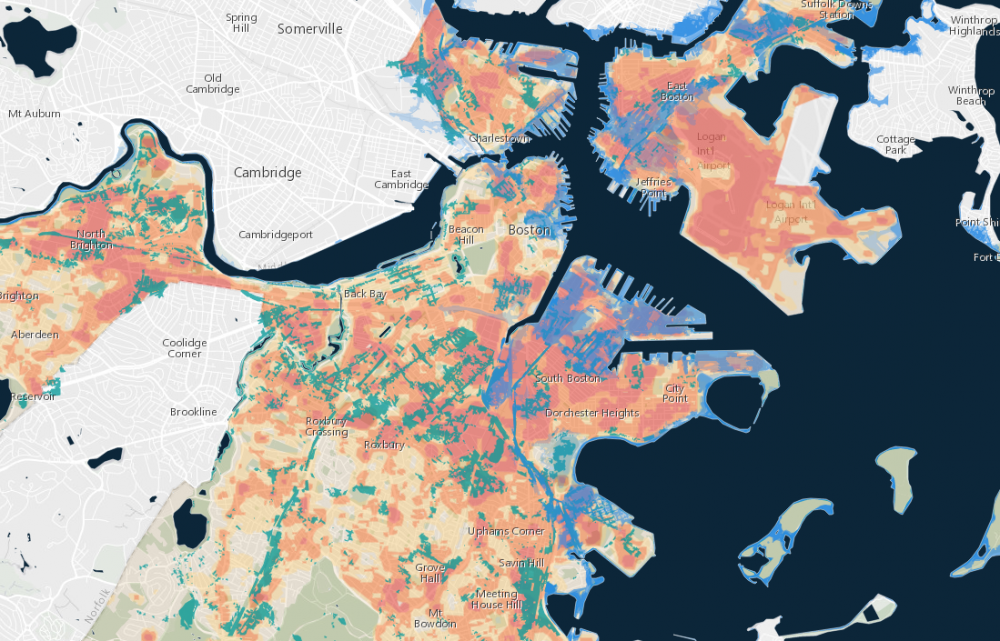
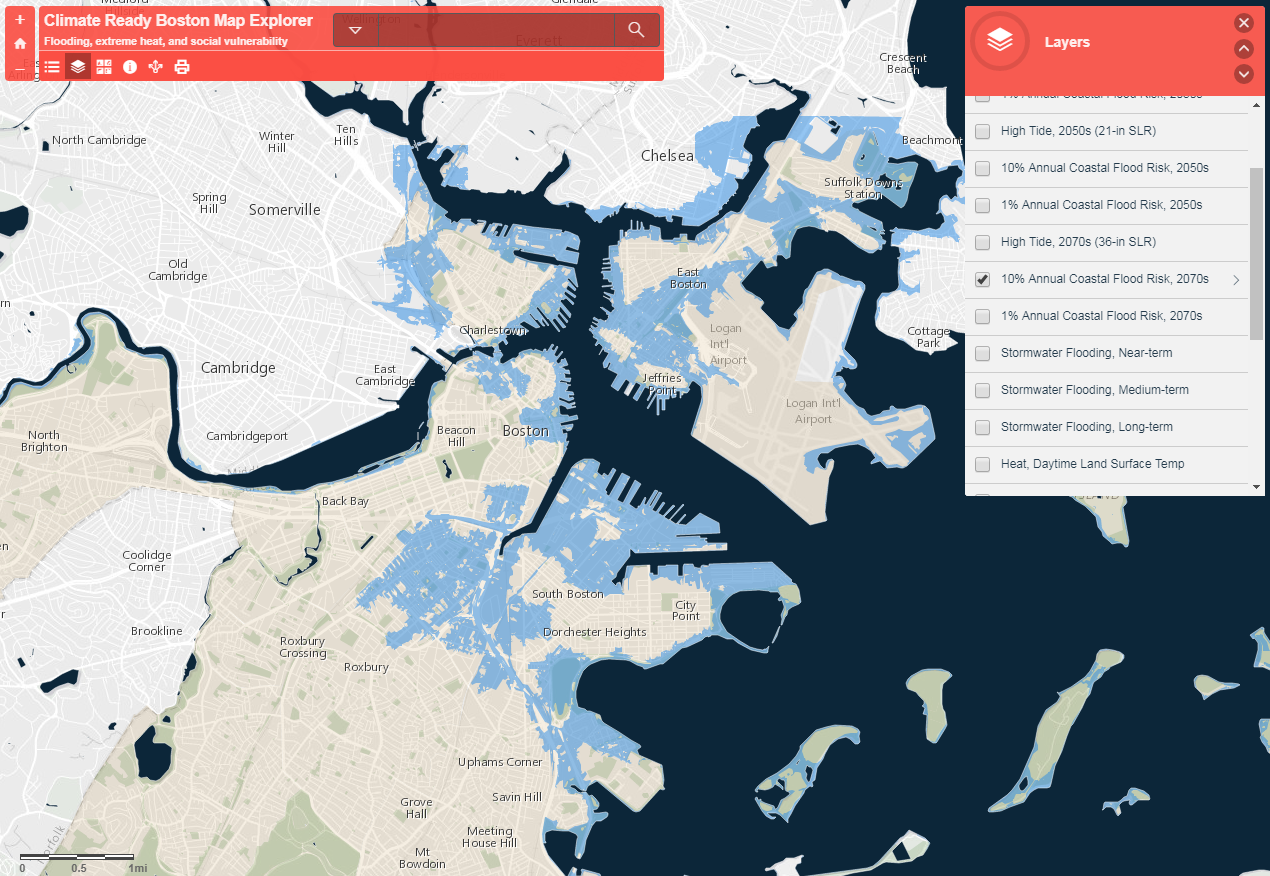
Here, for instance, is a screenshot of potential coastal flooding in the 2070s, in the event of a storm that has a 10 percent chance of hitting any given year. It takes into account high tide and projected sea level rise of 3 feet by the 2070s:
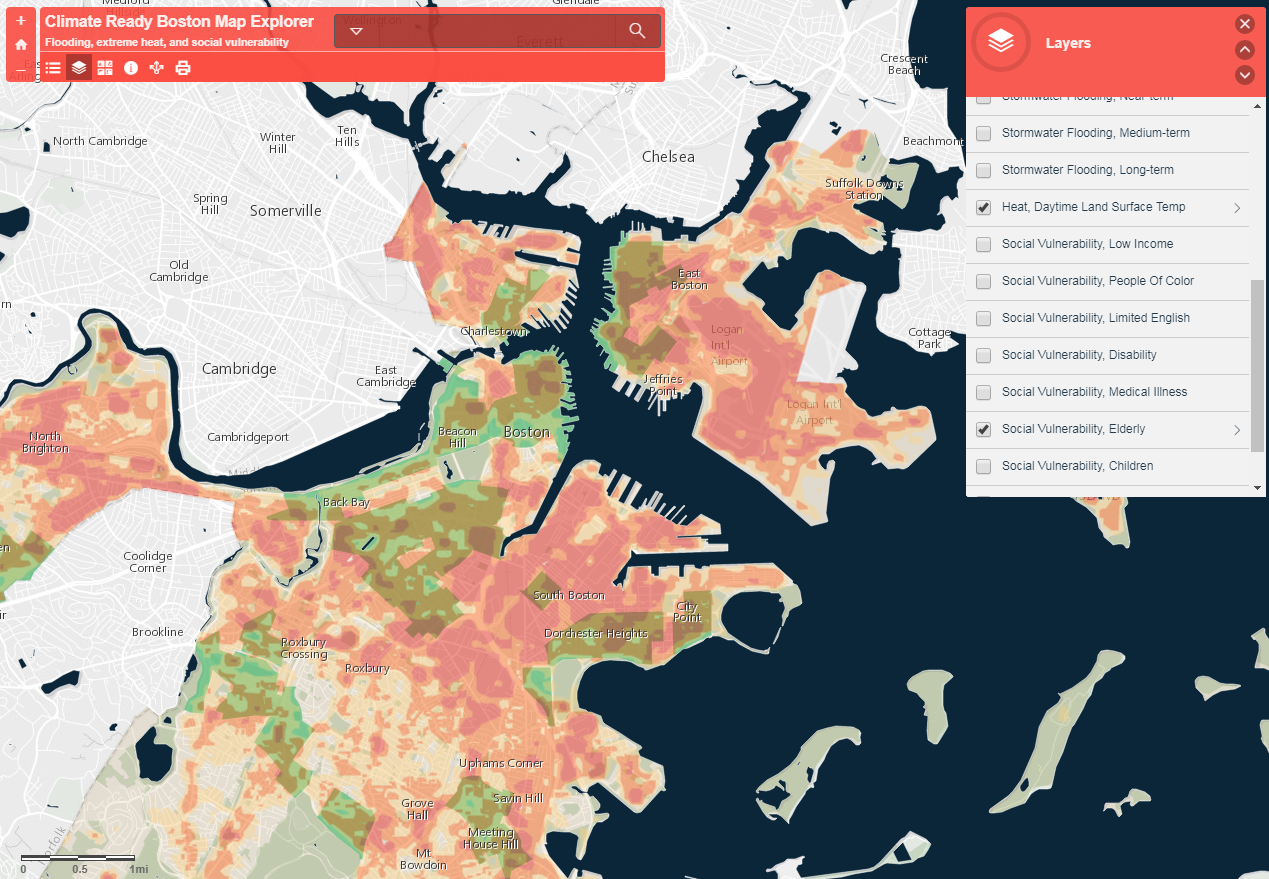
And here are areas of elevated heat overlaid with locations of relatively high concentrations of elderly people:
The city tool is not the first interactive to overlay coastal flooding risk on a Boston map, but it's the first to use localized data from the state's Boston Harbor Flood Risk Model. In addition to the map explorer, the city has made the coastal flooding, heat island and social vulnerability data available for public download.
Several of the data points made visible by the map — like urban heat islands and flooding concerns in low-lying communities — were explored in our summer series on climate change. You can see the full series here.
