Support WBUR
Analysis
Boston's Parking Permit Debate Highlights Inequities Of Vehicle Access, City Resources
Last month, Boston City Councilor Michelle Wu introduced a proposal to charge residents for neighborhood and guest parking permits. The fees are modest by Boston parking standards. For instance, the $25 fee for one car for a year is less than what many garages charge for one day.
Still, Boston Mayor Marty Walsh quickly dismissed the idea.
"Charging somebody who lives in the city of Boston, who pays taxes in the city of Boston, who owns a home in the city of Boston or rents in the city of Boston, charging them for a parking sticker to park on their street, I just don't feel is fair," Walsh told "Boston Public Radio."
This definition of fairness is a narrow one. Not every Boston resident owns a car, while everyone pays taxes to maintain public streets where drivers park for free.
A new analysis of the most recent U.S. Census data for Boston shows that people without access to a vehicle disproportionately have lower incomes, are less educated and are nonwhite.
Moreover, new polling data released in April show those without cars are more likely to rely on public transit, including buses, that then must contend with the city’s snarling traffic created in large part by car owners.
Census Data
The latest data from the five-year American Community Survey (2013-2017) show that 28% of households in Boston do not have access to a vehicle. (This is a broader measure than asking about car ownership, and likely underestimates the proportion who do not have a car in the city.) Asian (35%), Hispanic (35%) and black (29%) households are less likely to have access to a vehicle compared to white households (23%).
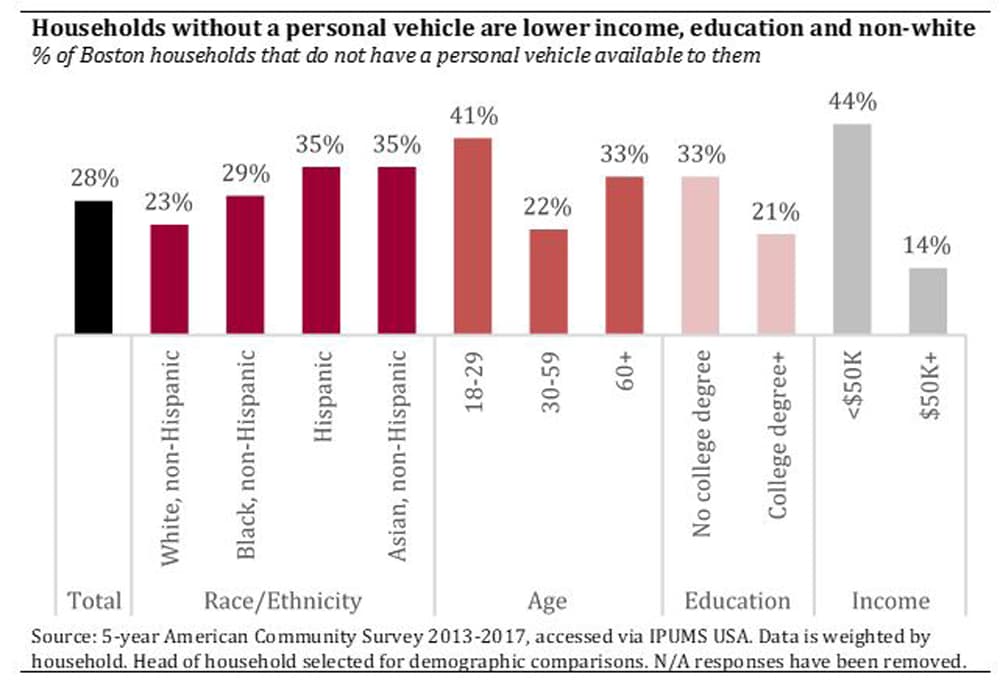
Further, households with lower levels of income and education are more likely to lack car access. In total, 44% of households with an annual income under $50,000 do not have a vehicle available to them, along with 33% of households headed by someone without a college degree. By comparison, only 14% of higher-income households and 21% of college-educated households lack access to a vehicle.
The youngest and oldest residents of Boston are more likely to be without a car. In households headed by those ages 18 to 29 or 60 and older, 41% and 33%, respectively, do not have access to a vehicle. Among those households headed by someone ages 30 to 59, only 22% do not have access to a car. There are likely several factors contributing to this, but parenthood may be one of them.
Our latest poll on transportation for the Barr Foundation found voters with children living with them were more likely to have one or more cars. The poll also tracked with the census in finding that nonwhite voters and voters with lower levels of education and income were more likely to not have a household car. (Disclosure: The Barr Foundation supports WBUR.)
Polling Data
The poll also highlights how car ownership and public transportation use coincide. Statewide, 50% of carless voters use a public bus to get around and 43% use the MBTA subway system. Overall, 47% use transit for all or most of their trips.
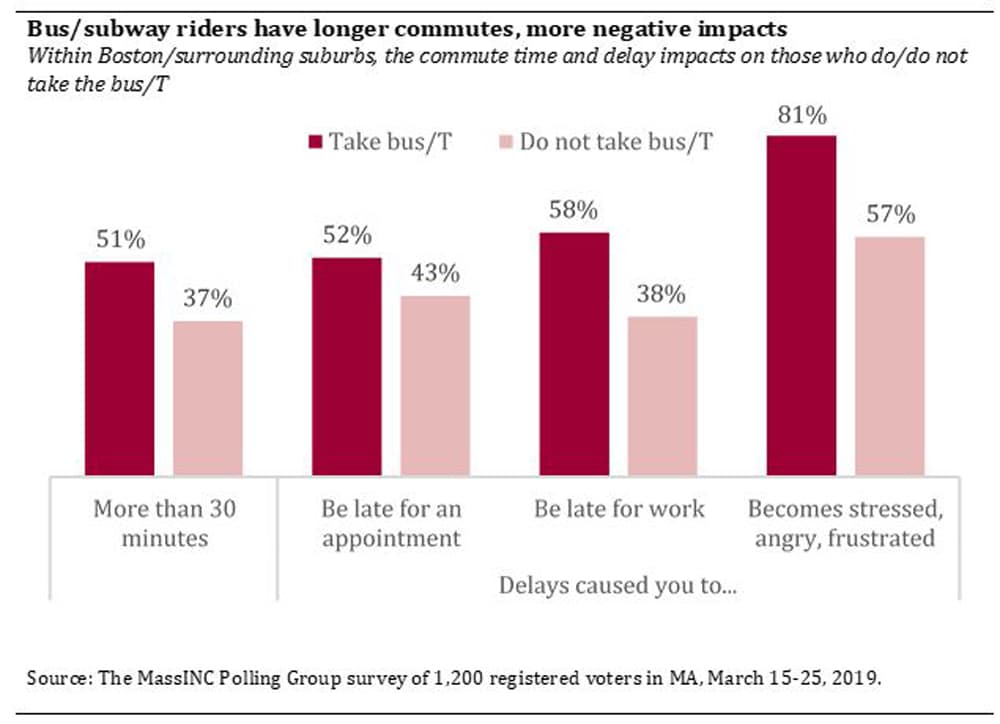
In Boston and its immediate suburbs, where transit use is most concentrated, bus and subway riders have longer commutes and higher levels of negative impacts from them. About half (51%) of bus and subway riders in this region report a morning commute of longer than 30 minutes, compared to a little more than a third among all others (37%). Bus and subways riders are also more likely to say that travel delays have made them late for work (58% versus 38%) or appointments (52% versus 43%). Four-fifths (81%) of transit riders in this area say those delays have made them feel stressed, angry or frustrated, compared to 57% among others.
The combined effect shows the regressive nature of Boston’s free resident parking. Transportation experts are increasingly focused on the inherent inequality of using public streets to store private property.
The problem is threefold: First, parked cars take up space on streets and clog major thoroughfares for everyone. Second, free parking uses public resources to incentivize people to drive and own cars, instead of using public transportation, making traffic worse. Lastly, those who are most dependent on public transportation — the same groups outlined above — end up with longer commutes and less reliable service, as parked cars take up space that could be used for bus or bike lanes.
City officials are aware of these inequities. The GoBoston 2030 planning process included an extensive analysis of ACS data on commuting patterns by neighborhood of the city and by race. It found that nonwhite families use transit more often and are more likely to experience longer commutes. In neighborhoods with large nonwhite populations — Mattapan, East Boston, Hyde Park and Dorchester — an above-average share of residents is enduring hour-plus commutes.
Free parking works against recent efforts by the city to improve the flow of city streets. In a series of transportation initiatives released in March, the mayor announced two more dedicated bus lanes and the city’s first designated area for Uber and Lyft pickups and drop-offs.
Further, resident parking fees are already in place in the region. Cambridge has a similar structure to the one Councilor Wu proposes: $25 for the first car, and an additional $25 for every car after that. Other communities neighboring Boston, including Somerville and Brookline, also charge a fee.
Some of Walsh’s reaction may be well-warranted political caution. Parking is an emotional issue, especially in a city dotted with space savers in the winter. But it seems like no coincidence that the demographic groups most likely to own a vehicle are also those most likely to be registered voters in city elections. It’s hard to square the concept of fairness with asking the city’s least well-off residents to pay for parking spaces they will never use, and which make their lives measurably worse. Instituting a parking fee and using the proceeds to invest in better transit would get public space closer to being a two-way street.
*Source: 2017 American Community Survey, accessed via IPUMS USA. The data here has been calculated to only include applicable responses — i.e., “N/A” responses have been removed. Data does not include vacant units or group quarters. The data has been weighted by household and the head of household has been selected for demographic comparisons. For more information, see here.
Correction: An earlier version of this story included an incorrect title for Boston City Councilor Michelle Wu. The story has been updated.
Maeve Duggan is research director for the MassINC Polling Group, which conducts surveys for WBUR. She is a regular contributor to WBUR. She tweets @maeveyd.
This article was originally published on May 07, 2019.