Support WBUR
Boston Under Water
8 maps that explain Boston's changing shoreline
About one-sixth of Boston sits on landfill. That’s an astonishing amount, and that history of landmaking is part of what makes Boston so vulnerable to sea level rise today. People built new land by filling in the spaces between wharves, or building out into marshes and tidal flats, and usually constructed their new land right above the high tide line. Now that climate change is causing rapid and accelerating sea-level rise around Boston, much of that made land isn’t quite high enough to resist the highest high tides, and the problem will worsen in coming decades.
These eight historical maps, selected by Garrett Dash Nelson, curator of Maps & Director of Geographic Scholarship at the Boston Public Library’s Leventhal Map & Education Center, offer snapshots of Boston’s growth over time, documenting the city's ongoing — and ever-changing — relationship with the sea.
Map of Boston, 1723
The Boston we see in this first map hardly resembles the city we know today. An English captain named John Bonner originally created the map in 1721, and it was revised many times throughout the 18th century. This particular version shows the city between 1723 and 1733. It provides some of the best evidence for what the city looked like in the first century of European colonization, before massive engineering projects dramatically reworked the city’s coastline.
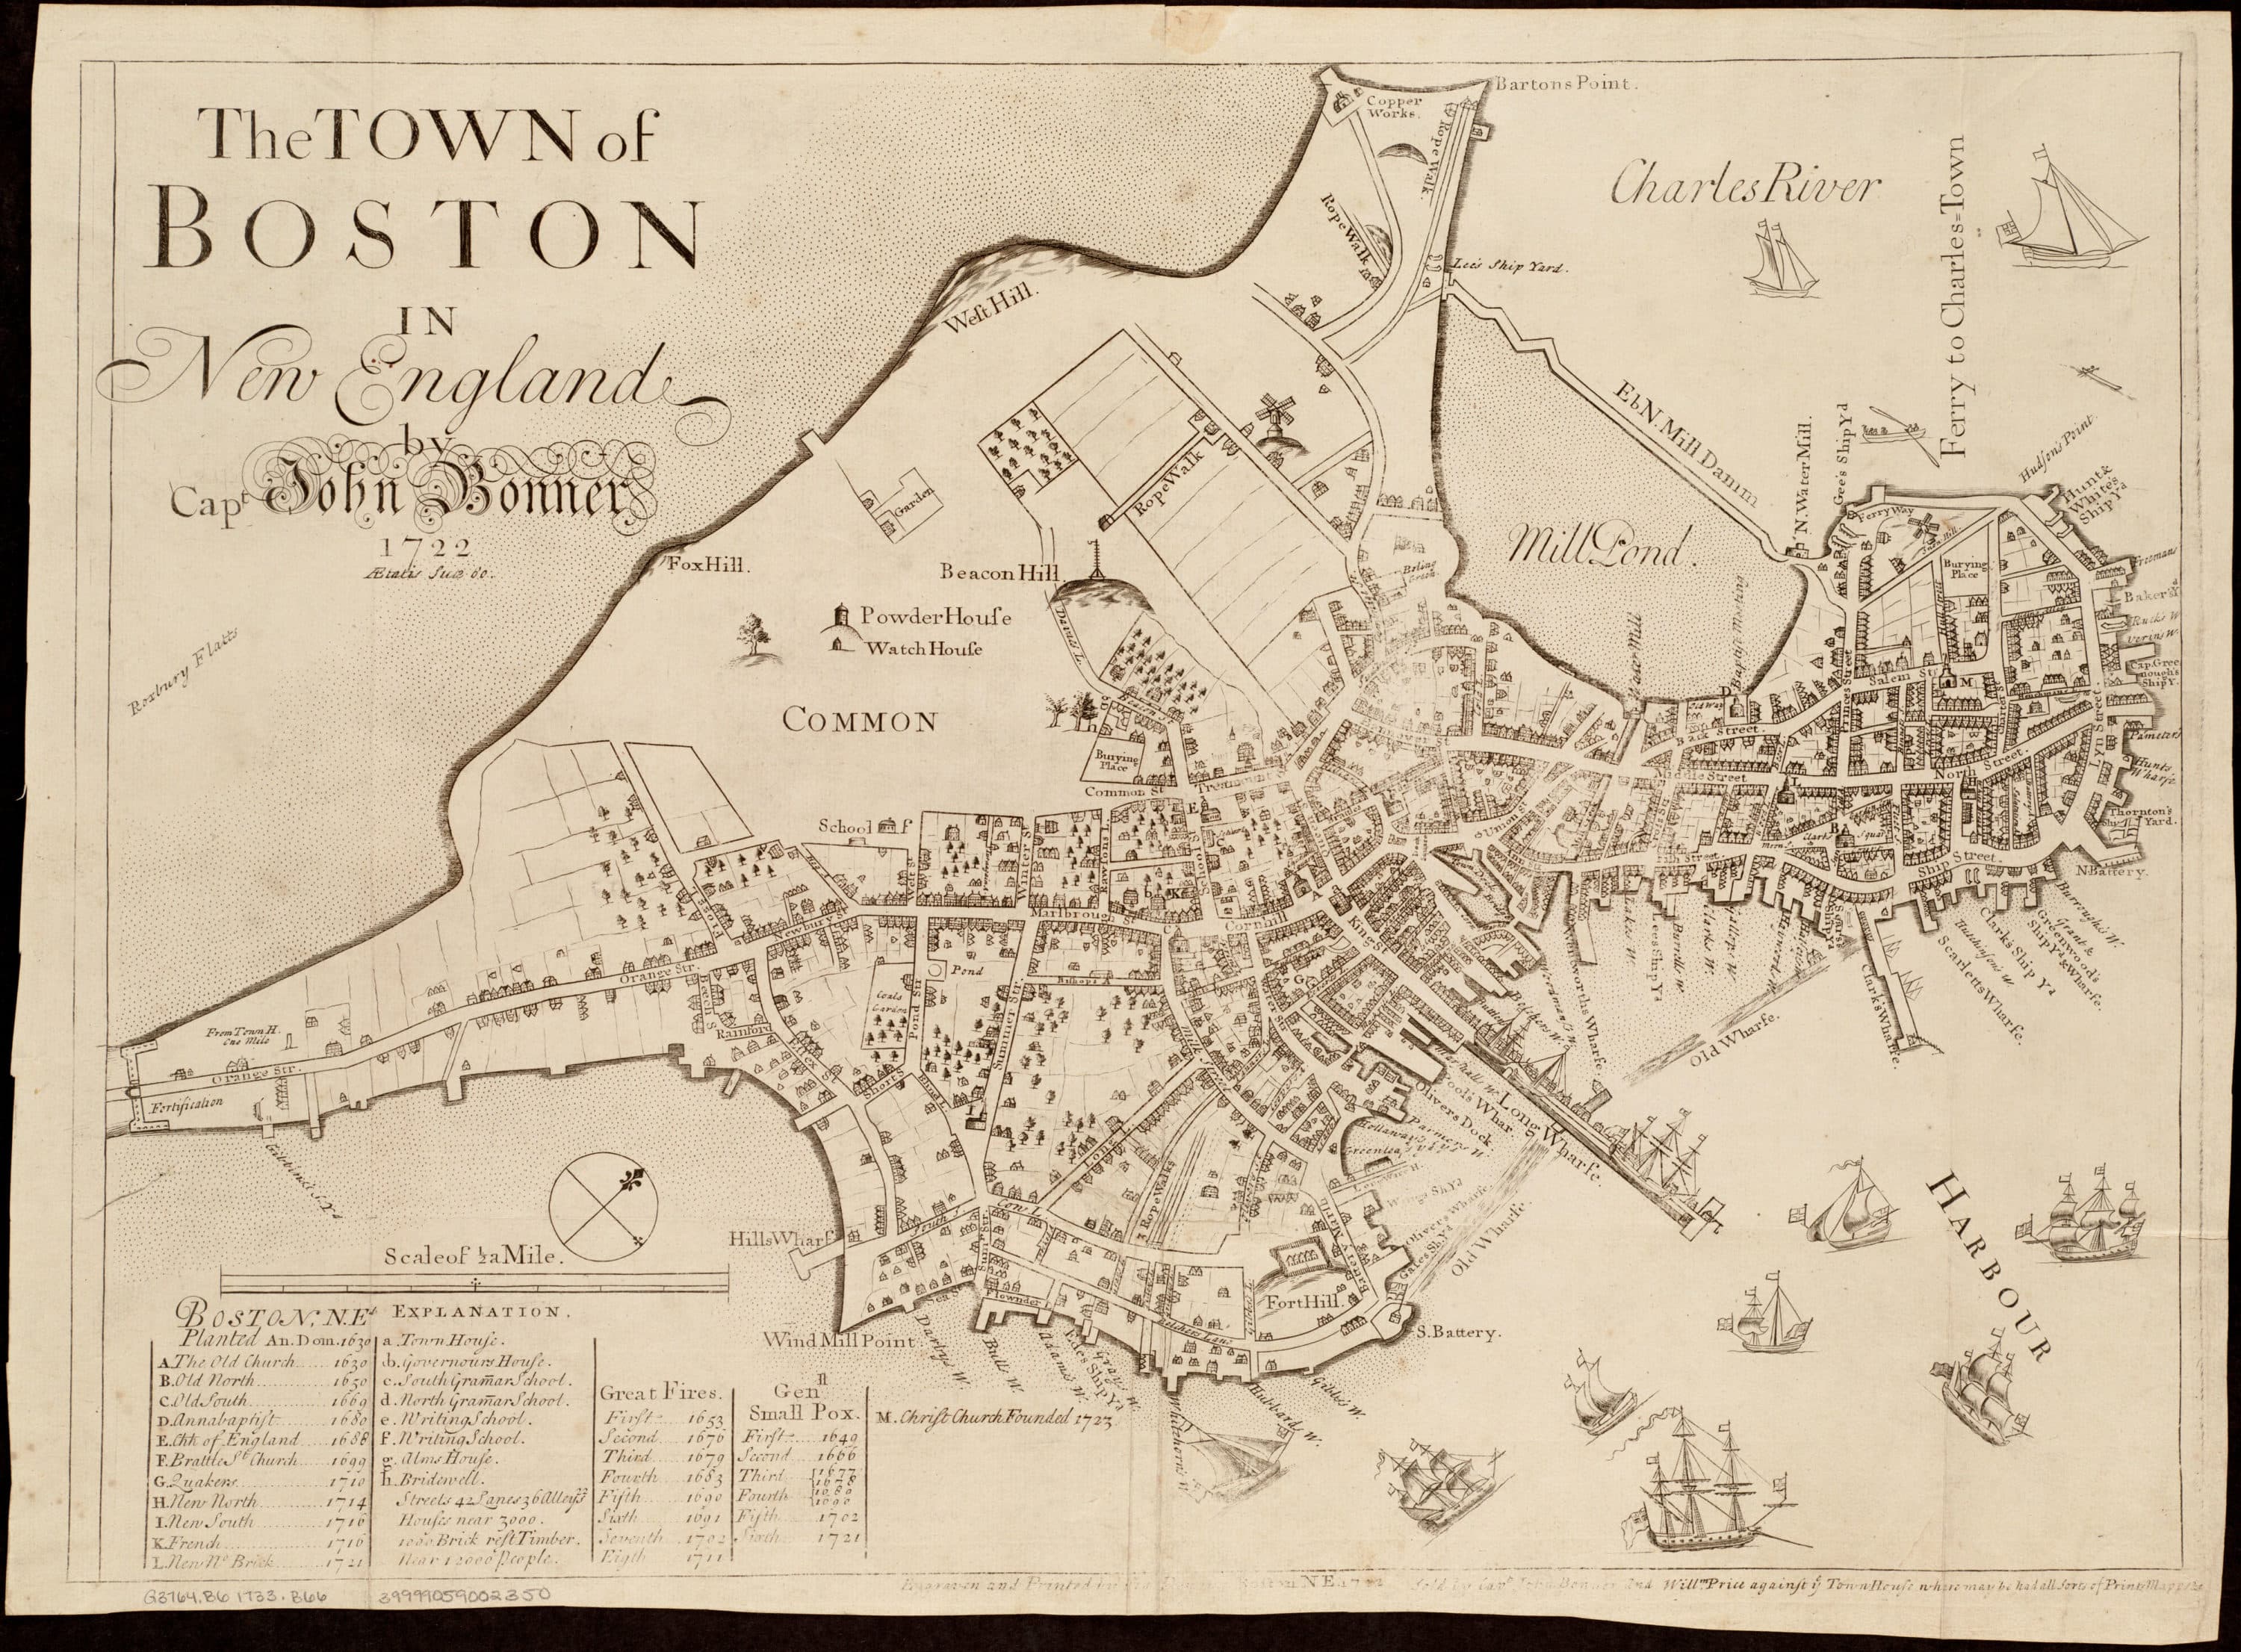
The Bonner map shows Boston sitting on a peninsula — in technical terms, it’s actually a “tied island” connected to land by a sandy spit called a “tombolo.” Tidal marshes and flats surrounded most of the city; the Common, near the center of the map, backed up onto Roxbury Flats, which stretched from what is now the Public Garden all the way to near Northeastern University. If you look at the lower right section of the map, you’ll see an arc of docks at the foot of King St. (now State St.) and Dock Square (where Faneuil Hall stands). That was the hub of Boston’s maritime traffic.
The Boston peninsula was a good place for defenses, and also a rich intertidal ecosystem. The Massachusett people knew that the marshes around this peninsula — known as Mashauwomuk (or Shawmut) — held thriving fisheries. The fish weirs they built were some of the most important and extensive human interventions into the coastal landscape. Early European communities relied heavily on Indigenous ecological and economic systems for their survival.
Boston Begins “Wharfing Out,” 1708
Colonial Boston depended on the ocean for trade, food, and a constant influx of settlers from England. But the shallow water surrounding much of the city was a problem for loading and unloading ships. Wharf builders came up with a solution: they stretched their wharves further and further into the harbor to accommodate large and small craft, even at low tide. These ever-more elaborate fingers jutting into the harbor eventually led the way towards Bostonians filling in the ocean to facilitate maritime trade.
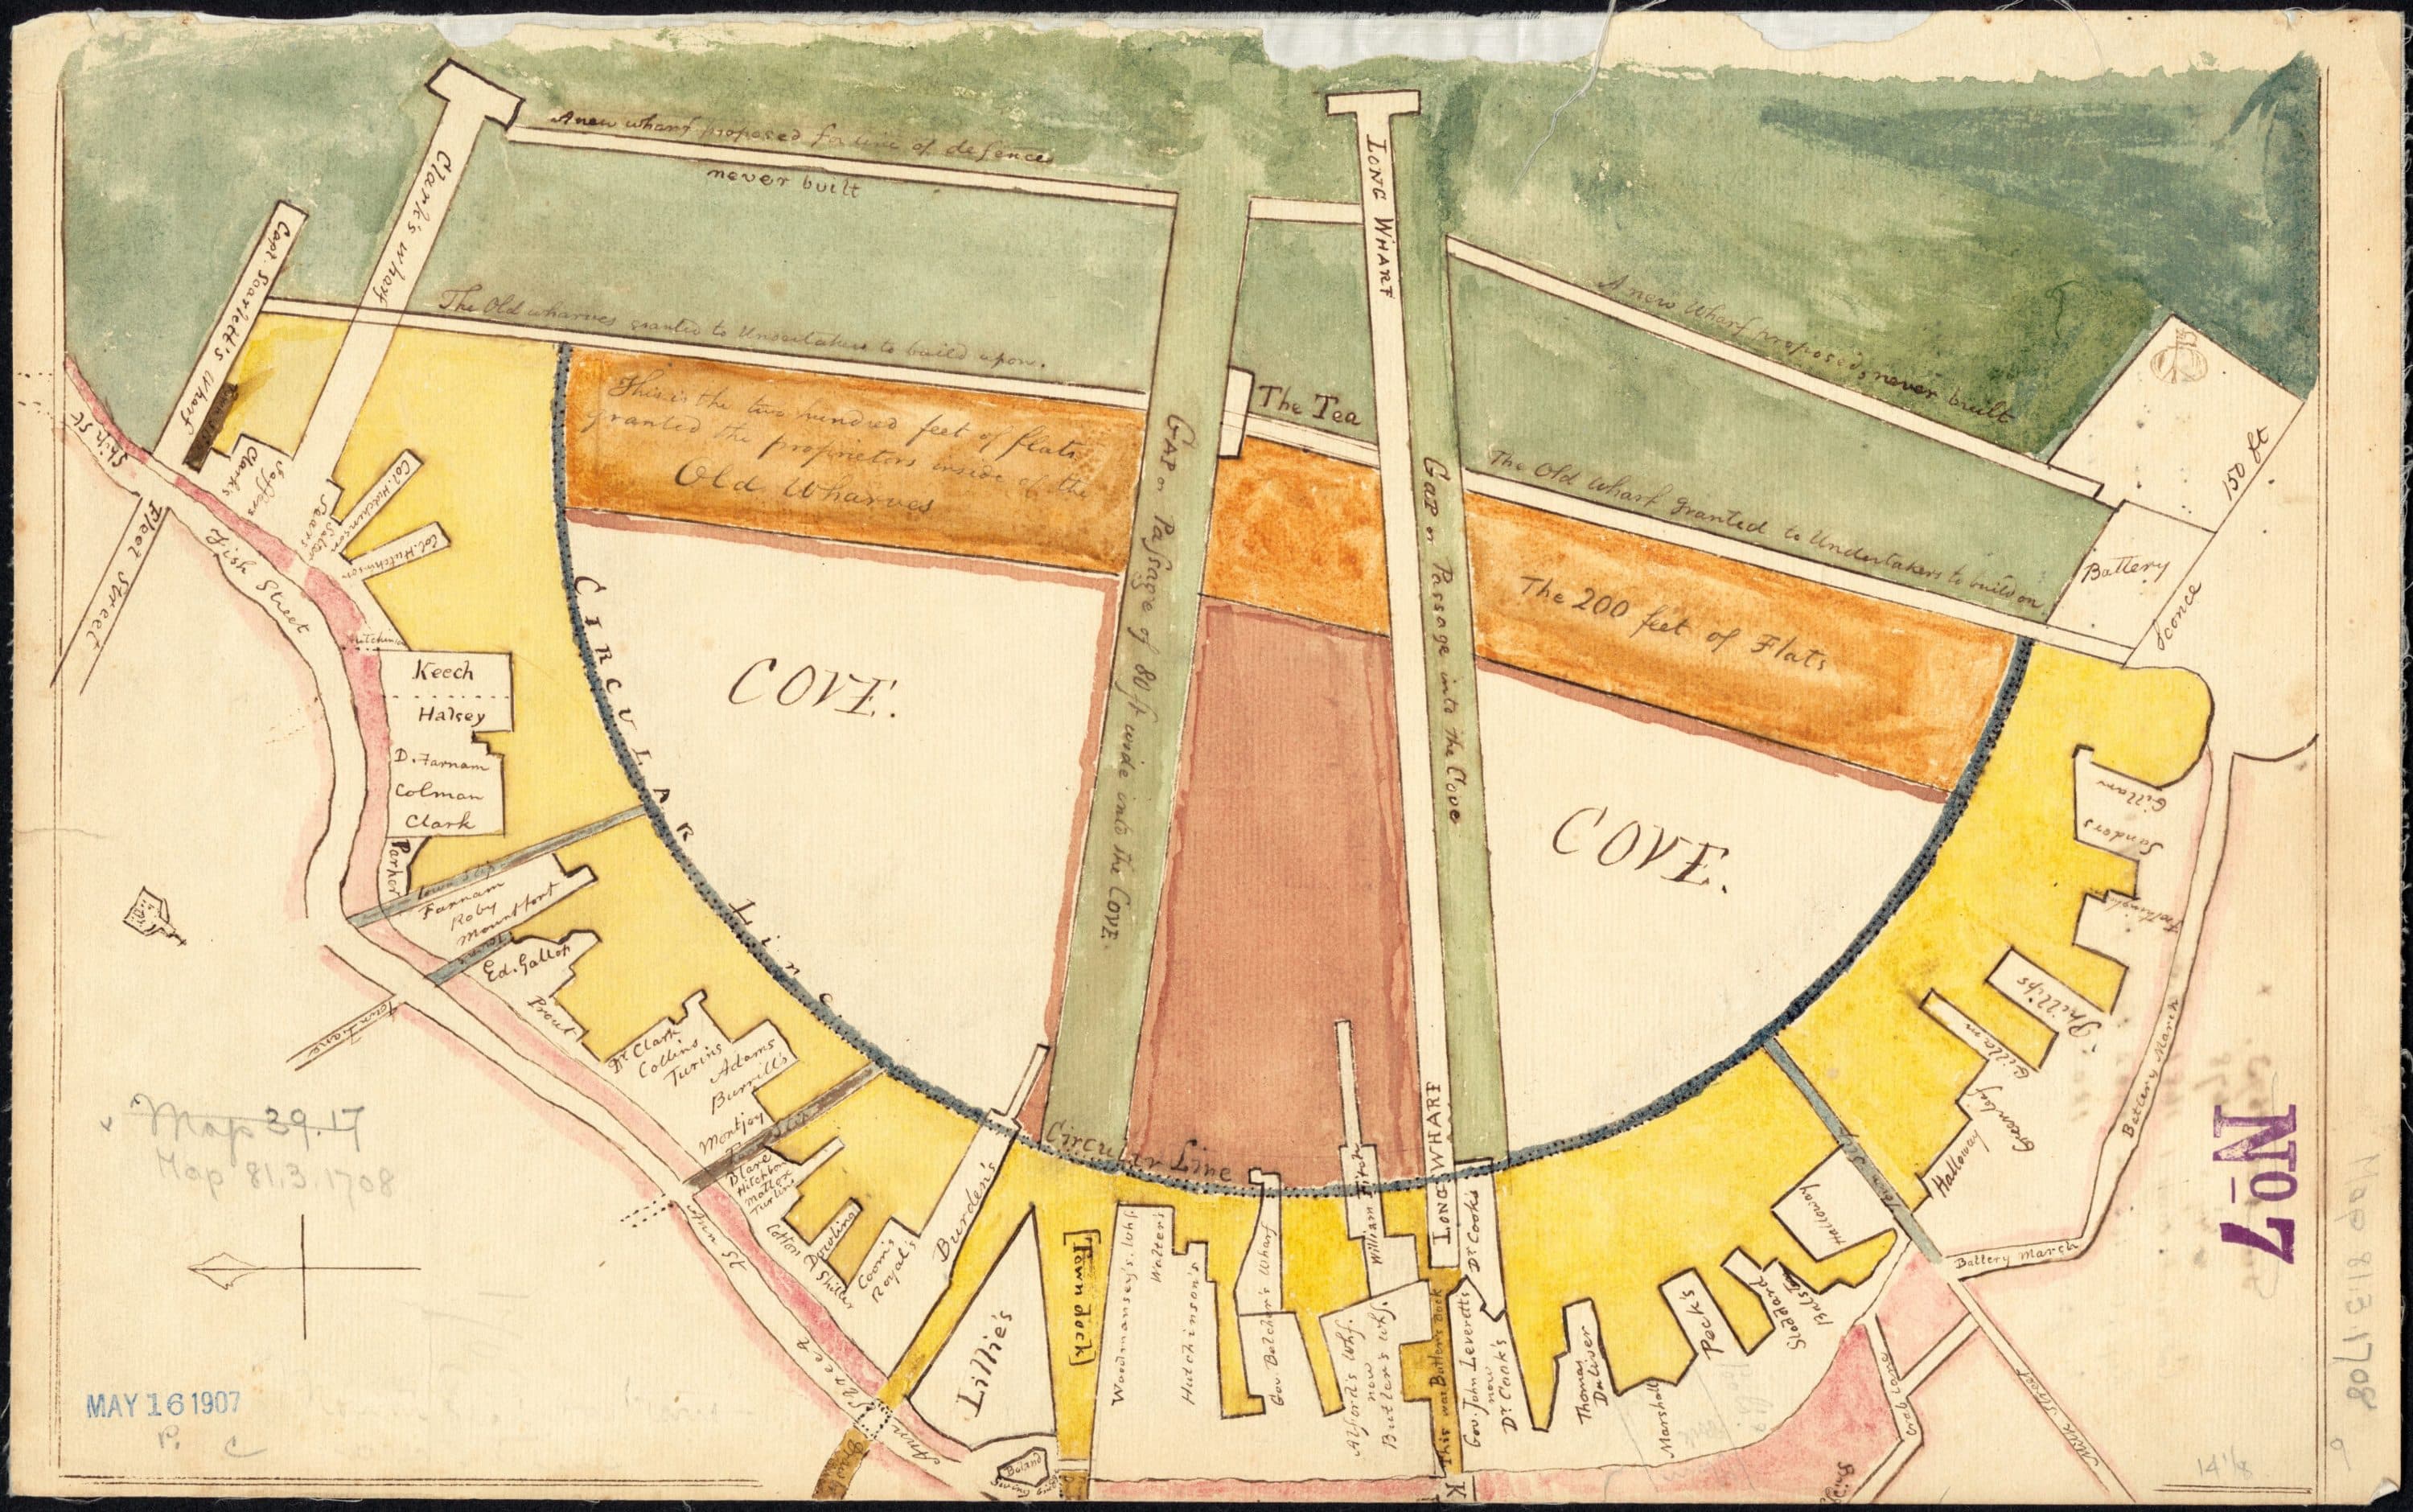
This color-coded map from the 1820s, redrawn from an original from the early 1700s, might seem a little confusing at first. The jagged white shapes at bottom are wharves poking into the harbor. If you look closely, you can see the appropriately-named Long Wharf jutting out into the water from about 5 o’clock to 12 o’clock. The line running perpendicular to Long Wharf marks the position of a defensive jetty called the “Barricado,” built in 1673 but soon abandoned. The brown area, labelled “200 feet of flats,” was pierced by two inlets that allowed boats to sail to the smaller wharves and docks.
A notable feature on this map is the thin blue half-circle near the wharves, which indicates an early conflict between private enterprise and public regulation on the shoreline. The city government at the time feared wharf builders would continue crowding the harbor with their irregularly-shaped shoreline alterations. To regularize the waterfront, officials drew an imaginary arc and prohibited wharves from extending beyond it.
Bulfinch Triangle, 1807
European colonists wanted to build lumber and grist mills, but they were stymied by the physical geography of Eastern Massachusetts, which has few fast-running rivers, and therefore few good sites for mills. Colonists adapted to this lack of natural hydropower by creating tidal mills. To create a tidal mill, engineers first built a dam to enclose a natural cove or inlet. The cove, now a mill pond, would fill with water as the tide came in, and, when it ran out, the rushing water powered waterwheels. The faint gray line running nearly parallel to the top of this map shows the mill dam built between the North End and West End along what is today Causeway Street.
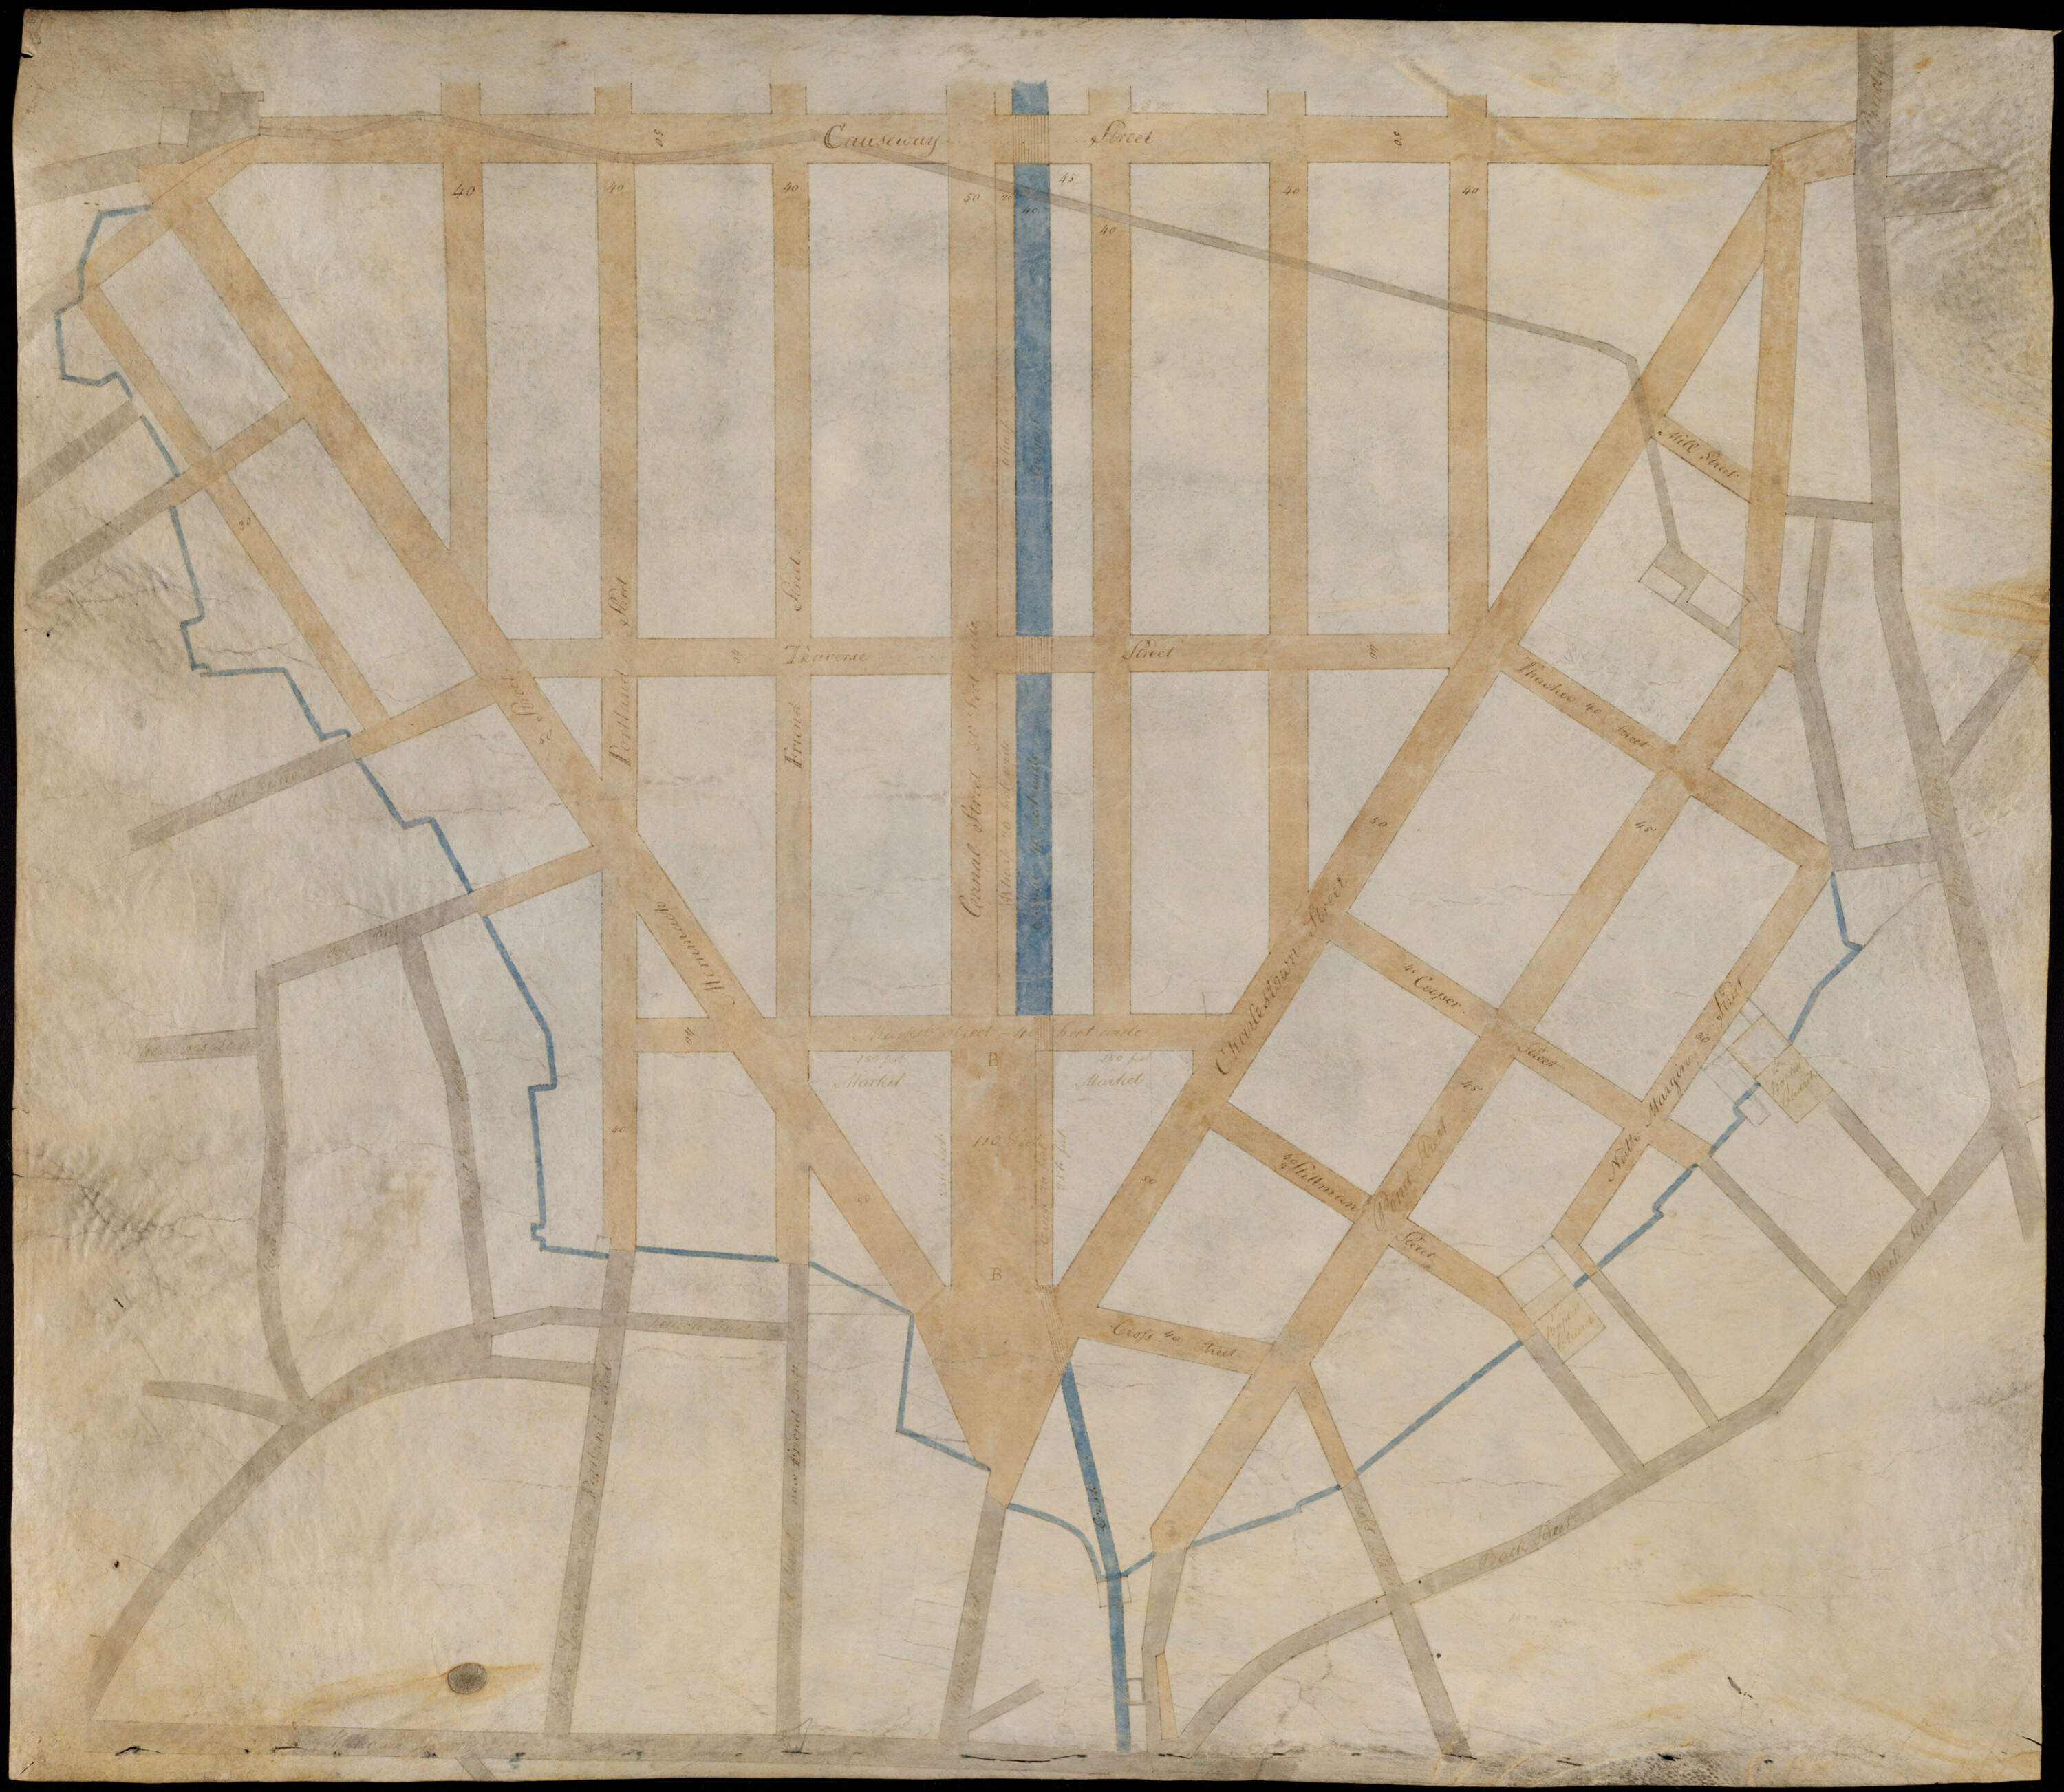
When white settlers pushed inland, violently removing Native peoples from their ancestral lands, they gained access to swifter rivers for water power, and the tidal dams no longer made economic sense. But the area behind these dams, the shallow water in the former mill ponds, offered an opportunity: a chance to make new land and develop entirely new neighborhoods.
One of the first of these was the “Bulfinch Triangle,” shown here as the architect Charles Bulfinch laid it out in 1807 behind Causeway Street. Bulfinch, like many of the land fillers that followed him, laid out streets in a tidy grid to facilitate easy division and sale, a pattern you can still see today in the streets of the triangular area between North Station and Haymarket. In fact, if you’re standing anywhere in Boston on gridded streets, chances are pretty good that you’re on filled land.
Back Bay, 1855
Filling in land behind tidal dams not only provided room for new neighborhoods, it also solved an urban planning challenge. Many of the mill dam ponds had become smelly, dirty blights after the dams cut off the natural circulation of water from the ocean, and city residents started using the flats as sewer dumps. This map shows the first steps towards what became Boston’s most famous fill project, the conversion of the Boston Water Power Company’s Back Bay flats into a neatly gridded neighborhood of the same name.

The company had a mill dam running along what is now Beacon Street from the Public Garden to Kenmore Square, enclosing the Roxbury Flats and the outlet of the Muddy River into mill ponds. Economically unviable almost from the start, the enclosed flats became much more profitable as the site of a new neighborhood in an otherwise hemmed-in city.
If you look at the center of the map you’ll see two long lines forming an “X.” Those mark another engineering feature that accelerated the filling process: raised berms to carry railroads. The Worcester Railroad and the Providence Railroad built causeways through the Back Bay flats in the 1830s. These rail causeways cut off the flats from their former marine ecosystem and also provided a handy route for mechanized earth-moving machines to dump sand and gravel into the flats, the first step in creating new high-end properties.
Boston Harbor, 1852
As speculative fill projects began more aggressively intruding into the water, managing the harbor became more and more difficult. Beginning in the middle of the 19th century, the city, state, and federal governments began using regulations, informed by new scientific knowledge about hydrology, to try to maintain control of the harbor.

This map shows Boston Harbor in 1852, during the most frantic era of filling and development. The city’s historic shape is shown in white, with grayed-in areas showing completed or ongoing fill projects. Look closely and you can see the “commissioner’s lines,” the legal limits established on fill projects. The lines document an attempt to govern how the formerly common property of tidal flats became transformed into new land for industry, residences, and transportation.
Sewer Drainage, 1875
Boston also began reaching out into the harbor to solve another urban planning problem: the city’s exponentially growing volume of sewage. This 1875 map shows the proposed routes for two main sewer lines in Boston. The southern line was drawn from the Cottage Farm station (near Boston University) to a pumping station in Dorchester, and on through a submarine channel to Moon Island. It was completed in the early 1880s with a slightly modified route, beginning near what is now Northeastern University. The plan for a northern sewer line ran from Cambridge to Winthrop, terminating at Point Shirley, near the site of today’s massive MWRA sewer treatment plant on Deer Island. It wasn’t completed until 1890, when the Metropolitan Sewerage District gained the authority to build sewer lines crossing municipal boundaries.

The diagram on the bottom of the map shows how sewer lines sloped downward as much as possible, using gravity to avoid the need for costly and unreliable pumping stations. This meant engineers extended sewer pipes out into the harbor, to the lowest elevation possible. Dumping the sewage far out in the harbor was also an age-old solution to pollution: put it somewhere else.
A Celebration Of Shoreline Change, 1895
This map, printed in 1895, was designed to celebrate a century’s worth of shoreline transformation in Boston. The gray outline shows the coastline and streets of colonial Boston. Each subsequent color shows another step of outward growth: pink in 1796, green in 1850, and blue in 1895. This map dramatizes how the development of Back Bay essentially doubled Boston’s core area, while the margins of the map show parallel transformations in South Boston and Charlestown. Other parts of the metropolitan area grew at the same time, too — Cambridge, for instance, filled the Charles River estuary where MIT now stands.

For 19th-century Bostonians, landfill seemed like an unambiguous sign of progress, at a time when billowing smokestacks and clear-cut forests also symbolized a proud, enterprising nation. Only a few dissenters warned of the potential disasters lurking behind the hubristic re-engineering of the natural landscape.
Nobody at this time could foresee the rising sea levels of climate change that now confront the city, but concerns around industrial exploitation of Boston’s environment did lead to projects like the famous Emerald Necklace and, later, the establishment of a metropolitan park system. The latter offered one of the first opportunities to treat the coastline not only as an economic tool but as a recreational amenity, with bathhouses and beaches built for public enjoyment.
If you zoom in on Copley Square and the BPL on this map, you can get a sense of how much Boston has changed. Standing in Copley Square today, with the Hancock Tower on one side and the Prudential on the other, it’s hard to imagine that less than 200 years ago this spot was marshy tide lands, with a few high points peeking out of the water.
The Neighborhood That Wasn’t, 1970s
While most of Boston’s major filled neighborhoods were complete by the early twentieth century, the coastline continued to change. The most important coastline reconfiguration was the development of Logan Airport in the 1940s and 50s. In a dense city, flats and coastal areas still seemed like promising locations for land-hungry facilities, like the highways that would become I-93 on the Millers River in Somerville and through the South Bay in Dorchester.

This map shows a plan from the 1970s to continue Boston’s tradition of developing new neighborhoods on made land. Developers proposed filling tidal flats in Dorchester Bay for an experimental new town, built for a world expo as Boston celebrated the nation’s bicentennial. The promoters described the project pictured here as a modern-day version of Bulfinch Triangle and Back Bay. Although city planning agencies seriously considered the plan, it never came to fruition.
Correction: This story has been updated to clarify that the 1875 map shows the proposed route of the Boston Main Drainage system, not the final location; and that the Worcester and Providence railroad lines in Back Bay were built in the 1830s.
This article was originally published on June 14, 2021.